Chapter 6: Projection Under Representative Climate Pathways
Universal Model Projection
Projections produced by the CNN-LSTMU universal model agree with the local model above where predicted for RCP8.5 is lower than that of RCP4.5 between 2020 and 2100. Differences between RCP4.5 and RCP8.5 for the Comet Post Office site are shown to be positive in Figure 88 with a range between -17.31\(Wm^{- 2}\) and 44.81\(\text{\ W}m^{- 2}\) with a majority of positive differences. Similarly the histogram of differences in profiles for site Majors Creek in Figure 89 indicate positive differences, with a minimum value of -8.91 \(Wm^{- 2}\) in 2060 and a maximum difference of 40.51\(\text{\ W}m^{- 2}\) in 2070. Averages for the minimum values of radiation per decade along with the upper and lower MPI for Comet Post Office are shown in Table 40 and in Table 43 for Majors Creek. Differences in the averages of the minimum show little difference between the average minimum radiation for both profiles. Differences in the mean predicted radiation under each profile are shown in Table 41 and Table 44 indicating a slight decrease in radiation in 2100. In the case of differences for average maximum values at both sites, there is little difference in average maximum solar radiation per decade in 2100 (Table 42 and Table 45). The 12 month moving average for all sites is shown in Figure 90, Figure 91 and Figure 92, the difference between the moving average for RCP8.5 and RCP4.5 is less than that for the local model. For a number of sites, the 12 month moving average for RCP8.5 exceeds that of RCP4.5 mid-century, however is estimated to be slightly lower than radiation under RCP4.5 between 2090 and 2100, with a slight increase close to 2100.
Table 40 Average predicted values for \(\pm 95\%\) MPI and predicted radiation \(\widehat{r}\) \(Wm^{- 2}\) for the minimum values per decade under RCP4.5 and RCP8.5 scenarios at Comet Post Office. The difference between RCP4.5 and RCP8.5 is shown for the MPI (\(\Delta\) \(\pm 95\%\) MPI) as well as for the mean estimated radiation \(\Delta\widehat{r}\).
|
RCP4.5 Minimum (average) \(\mathbf{W}\mathbf{m}^{- \mathbf{2}}\) |
RCP8.5 Minimum (average) \(\mathbf{W}\mathbf{m}^{- \mathbf{2}}\) |
Difference \(\mathbf{W}\mathbf{m}^{- \mathbf{2}}\) | |||||||
|---|---|---|---|---|---|---|---|---|---|
| Decade | -MPI | \[\widehat{\mathbf{r}}\] | +MPI | -MPI | \[\widehat{\mathbf{r}}\] | +MPI | \(\mathbf{\Delta}\) -MPI | \[\mathbf{\Delta}\widehat{\mathbf{r}}\] | \(\mathbf{\Delta}\) +MPI |
| 2030 | 63.51 | 169.71 | 275.91 | 63.01 | 169.71 | 276.41 | 0.50 | 0.00 | -0.50 |
| 2040 | 63.51 | 169.71 | 275.91 | 63.04 | 169.74 | 276.44 | 0.48 | -0.02 | -0.52 |
| 2050 | 63.51 | 169.71 | 275.91 | 63.03 | 169.73 | 276.43 | 0.49 | -0.01 | -0.51 |
| 2060 | 63.51 | 169.71 | 275.91 | 63.01 | 169.71 | 276.41 | 0.50 | 0.00 | -0.50 |
| 2070 | 63.51 | 169.71 | 275.91 | 63.01 | 169.71 | 276.41 | 0.50 | 0.00 | -0.50 |
| 2080 | 63.51 | 169.71 | 275.91 | 63.01 | 169.71 | 276.41 | 0.50 | 0.00 | -0.50 |
| 2090 | 63.51 | 169.71 | 275.91 | 63.01 | 169.71 | 276.41 | 0.50 | 0.00 | -0.50 |
| 2100 | 63.51 | 169.71 | 275.91 | 63.01 | 169.71 | 276.41 | 0.50 | 0.00 | -0.50 |
Table 41 Average predicted values for \(\pm 95\%\) MPI and predicted radiation \(\widehat{r}\) \(Wm^{- 2}\) for the values per decade under RCP4.5 and RCP8.5 scenarios at Comet Post Office. The difference between RCP4.5 and RCP8.5 is shown for the MPI (\(\Delta\) \(\pm 95\%\) MPI) as well as for the mean estimated radiation \(\Delta\widehat{r}\).
|
RCP4.5 Average \(\mathbf{W}\mathbf{m}^{- \mathbf{2}}\) |
RCP8.5 Average \(\mathbf{W}\mathbf{m}^{- \mathbf{2}}\) |
Difference \(\mathbf{W}\mathbf{m}^{- \mathbf{2}}\) | |||||||
|---|---|---|---|---|---|---|---|---|---|
| Decade | -MPI | \[\widehat{\mathbf{r}}\] | +MPI | -MPI | \[\widehat{\mathbf{r}}\] | +MPI | \(\mathbf{\Delta}\) -MPI | \[\mathbf{\Delta}\widehat{\mathbf{r}}\] | \(\mathbf{\Delta}\) +MPI |
| 2030 | 114.00 | 220.20 | 326.40 | 114.11 | 220.81 | 327.51 | -0.11 | -0.61 | -1.11 |
| 2040 | 113.85 | 220.05 | 326.25 | 114.91 | 221.61 | 328.31 | -1.06 | -1.56 | -2.06 |
| 2050 | 115.17 | 221.37 | 327.57 | 115.89 | 222.59 | 329.29 | -0.72 | -1.22 | -1.72 |
| 2060 | 114.63 | 220.83 | 327.03 | 115.16 | 221.86 | 328.56 | -0.53 | -1.03 | -1.53 |
| 2070 | 112.77 | 218.97 | 325.17 | 112.13 | 218.83 | 325.53 | 0.63 | 0.13 | -0.37 |
| 2080 | 113.76 | 219.96 | 326.16 | 113.19 | 219.89 | 326.59 | 0.57 | 0.07 | -0.43 |
| 2090 | 114.41 | 220.61 | 326.81 | 113.94 | 220.64 | 327.34 | 0.47 | -0.03 | -0.53 |
| 2100 | 113.86 | 220.06 | 326.26 | 112.38 | 219.08 | 325.78 | 1.48 | 0.98 | 0.48 |
Table 42 Average predicted values for \(\pm 95\%\) MPI and predicted radiation \(\widehat{r}\) \(Wm^{- 2}\) for the maximum values per decade under RCP4.5 and RCP8.5 scenarios at Comet Post Office. The difference between RCP4.5 and RCP8.5 is shown for the MPI (\(\Delta\) \(\pm 95\%\) MPI) as well as for the mean estimated radiation \(\Delta\widehat{r}\).
|
RCP4.5 Maximum (average) \(\mathbf{W}\mathbf{m}^{- \mathbf{2}}\) |
RCP8.5 Maximum (average) \(\mathbf{W}\mathbf{m}^{- \mathbf{2}}\) |
Difference \(\mathbf{W}\mathbf{m}^{- \mathbf{2}}\) | |||||||
|---|---|---|---|---|---|---|---|---|---|
| Decade | -MPI | \[\widehat{\mathbf{r}}\] | +MPI | -MPI | \[\widehat{\mathbf{r}}\] | +MPI | \(\mathbf{\Delta}\) -MPI | \[\mathbf{\Delta}\widehat{\mathbf{r}}\] | \(\mathbf{\Delta}\) +MPI |
| 2030 | 167.97 | 274.17 | 380.37 | 167.45 | 274.15 | 380.85 | 0.53 | 0.03 | -0.47 |
| 2040 | 167.95 | 274.15 | 380.35 | 167.38 | 274.08 | 380.78 | 0.57 | 0.07 | -0.43 |
| 2050 | 167.75 | 273.95 | 380.15 | 167.32 | 274.02 | 380.72 | 0.43 | -0.07 | -0.57 |
| 2060 | 167.79 | 273.99 | 380.19 | 167.42 | 274.12 | 380.82 | 0.37 | -0.13 | -0.63 |
| 2070 | 167.76 | 273.96 | 380.16 | 166.72 | 273.42 | 380.12 | 1.04 | 0.54 | 0.04 |
| 2080 | 167.82 | 274.02 | 380.22 | 167.41 | 274.11 | 380.81 | 0.41 | -0.09 | -0.59 |
| 2090 | 167.89 | 274.09 | 380.29 | 167.48 | 274.18 | 380.88 | 0.42 | -0.08 | -0.58 |
| 2100 | 167.97 | 274.17 | 380.37 | 167.47 | 274.17 | 380.87 | 0.50 | 0.00 | -0.50 |
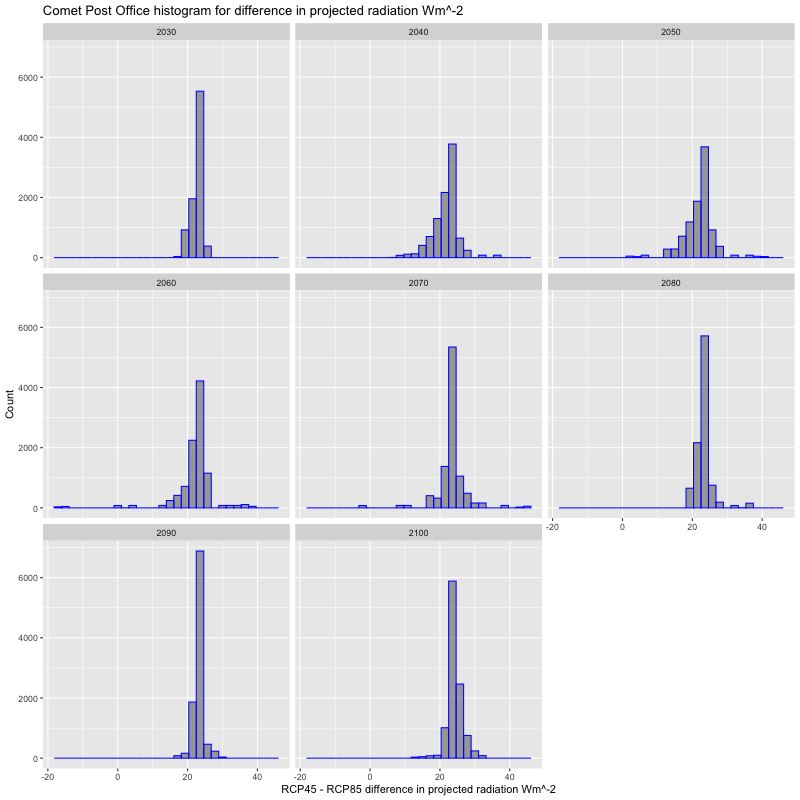
Figure 88 Histogram of differences between CNN-LSTMU projections at site Comet Post Office, RCP4.5 and RCP8.5, for decades 2030-2100
Table 43 Average predicted values for \(\pm 95\%\) MPI and predicted radiation \(\widehat{r}\) \(Wm^{- 2}\) for the minimum values per decade under RCP4.5 and RCP8.5 scenarios at Majors Creek. The difference between RCP4.5 and RCP8.5 is shown for the MPI (\(\Delta\) \(\pm 95\%\) MPI) as well as for the mean estimated radiation \(\Delta\widehat{r}\).
|
RCP4.5 Minimum (average) \(\mathbf{W}\mathbf{m}^{- \mathbf{2}}\) |
RCP8.5 Minimum (average) \(\mathbf{W}\mathbf{m}^{- \mathbf{2}}\) |
Difference \(\mathbf{W}\mathbf{m}^{- \mathbf{2}}\) | |||||||
|---|---|---|---|---|---|---|---|---|---|
| Decade | -MPI | \[\widehat{\mathbf{r}}\] | +MPI | -MPI | \[\widehat{\mathbf{r}}\] | +MPI | \(\mathbf{\Delta}\) -MPI | \[\mathbf{\Delta}\widehat{\mathbf{r}}\] | \(\mathbf{\Delta}\) +MPI |
| 2030 | 63.51 | 169.71 | 275.91 | 63.01 | 169.71 | 276.41 | 0.50 | -0.00 | -0.50 |
| 2040 | 63.51 | 169.71 | 275.91 | 63.07 | 169.77 | 276.47 | 0.44 | -0.06 | -0.56 |
| 2050 | 63.51 | 169.71 | 275.91 | 63.03 | 169.73 | 276.43 | 0.48 | -0.02 | -0.52 |
| 2060 | 63.51 | 169.71 | 275.91 | 63.01 | 169.71 | 276.41 | 0.50 | -0.00 | -0.50 |
| 2070 | 63.51 | 169.71 | 275.91 | 63.01 | 169.71 | 276.41 | 0.50 | -0.00 | -0.50 |
| 2080 | 63.51 | 169.71 | 275.91 | 63.01 | 169.71 | 276.41 | 0.50 | -0.00 | -0.50 |
| 2090 | 63.51 | 169.71 | 275.91 | 63.01 | 169.71 | 276.41 | 0.50 | 0.00 | -0.50 |
| 2100 | 63.51 | 169.71 | 275.91 | 63.01 | 169.71 | 276.41 | 0.50 | 0.00 | -0.50 |
Table 44 Average predicted values for \(\pm 95\%\) MPI and predicted radiation \(\widehat{r}\) \(Wm^{- 2}\) per decade under RCP4.5 and RCP8.5 scenarios at Majors Creek. The difference between RCP4.5 and RCP8.5 is shown for the MPI (\(\Delta\) \(\pm 95\%\) MPI) as well as for the mean estimated radiation \(\Delta\widehat{r}\).
|
RCP4.5 Average \(\mathbf{W}\mathbf{m}^{- \mathbf{2}}\) |
RCP8.5 Average \(\mathbf{W}\mathbf{m}^{- \mathbf{2}}\) |
Difference \(\mathbf{W}\mathbf{m}^{- \mathbf{2}}\) | |||||||
|---|---|---|---|---|---|---|---|---|---|
| Decade | -MPI | \[\widehat{\mathbf{r}}\] | +MPI | -MPI | \[\widehat{\mathbf{r}}\] | +MPI | \(\mathbf{\Delta}\) -MPI | \[\mathbf{\Delta}\widehat{\mathbf{r}}\] | \(\mathbf{\Delta}\) +MPI |
| 2030 | 113.01 | 219.21 | 325.41 | 113.25 | 219.95 | 326.65 | -0.24 | -0.74 | -1.24 |
| 2040 | 112.31 | 218.51 | 324.71 | 114.22 | 220.92 | 327.62 | -1.91 | -2.41 | -2.91 |
| 2050 | 112.92 | 219.12 | 325.32 | 114.84 | 221.54 | 328.24 | -1.92 | -2.42 | -2.92 |
| 2060 | 112.01 | 218.21 | 324.41 | 113.71 | 220.41 | 327.11 | -1.70 | -2.20 | -2.70 |
| 2070 | 110.98 | 217.18 | 323.38 | 111.47 | 218.17 | 324.87 | -0.49 | -0.99 | -1.49 |
| 2080 | 111.96 | 218.16 | 324.36 | 112.52 | 219.22 | 325.92 | -0.56 | -1.06 | -1.56 |
| 2090 | 113.35 | 219.55 | 325.75 | 113.38 | 220.08 | 326.78 | -0.03 | -0.53 | -1.03 |
| 2100 | 112.85 | 219.05 | 325.25 | 112.30 | 219.00 | 325.70 | 0.56 | 0.06 | -0.44 |
Table 45 Average predicted values for \(\pm 95\%\) MPI and predicted radiation \(\widehat{r}\) \(Wm^{- 2}\) for the maximum values per decade under RCP4.5 and RCP8.5 scenarios at Majors Creek. The difference between RCP4.5 and RCP8.5 is shown for the MPI (\(\Delta\) \(\pm 95\%\) MPI) as well as for the mean estimated radiation \(\Delta\widehat{r}\).
|
RCP4.5 Maximum (average) \(\mathbf{W}\mathbf{m}^{- \mathbf{2}}\) |
RCP8.5 Maximum (average) \(\mathbf{W}\mathbf{m}^{- \mathbf{2}}\) |
Difference \(\mathbf{W}\mathbf{m}^{- \mathbf{2}}\) | |||||||
|---|---|---|---|---|---|---|---|---|---|
| Decade | -MPI | \[\widehat{\mathbf{r}}\] | +MPI | -MPI | \[\widehat{\mathbf{r}}\] | +MPI | \(\mathbf{\Delta}\) -MPI | \[\mathbf{\Delta}\widehat{\mathbf{r}}\] | \(\mathbf{\Delta}\) +MPI |
| 2030 | 167.98 | 274.18 | 380.38 | 167.47 | 274.17 | 380.87 | 0.51 | 0.01 | -0.49 |
| 2040 | 167.68 | 273.88 | 380.08 | 167.20 | 273.90 | 380.60 | 0.47 | -0.03 | -0.53 |
| 2050 | 167.66 | 273.86 | 380.06 | 167.22 | 273.92 | 380.62 | 0.44 | -0.06 | -0.56 |
| 2060 | 167.75 | 273.95 | 380.15 | 167.41 | 274.11 | 380.81 | 0.34 | -0.16 | -0.66 |
| 2070 | 167.82 | 274.02 | 380.22 | 167.11 | 273.81 | 380.51 | 0.71 | 0.21 | -0.29 |
| 2080 | 167.96 | 274.16 | 380.36 | 167.44 | 274.14 | 380.84 | 0.52 | 0.02 | -0.48 |
| 2090 | 167.98 | 274.18 | 380.38 | 167.48 | 274.18 | 380.88 | 0.50 | -0.00 | -0.50 |
| 2100 | 167.97 | 274.17 | 380.37 | 167.47 | 274.17 | 380.87 | 0.50 | 0.00 | -0.50 |
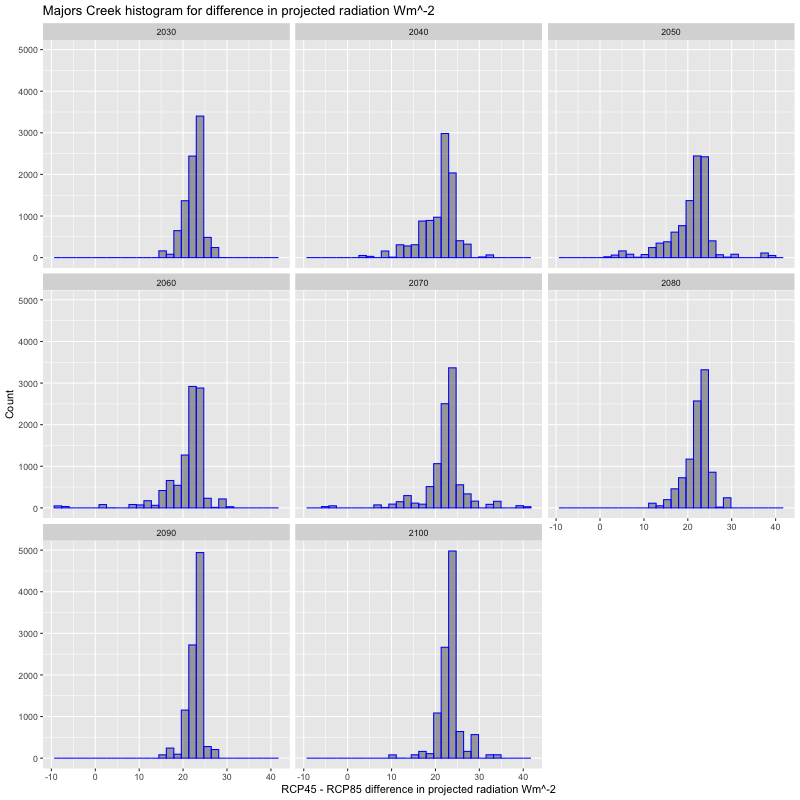
Figure 89 Histogram of differences between \(CNN - LSTM_{U}\) projections at site Majors Creek, RCP4.5 and RCP8.5, for decades 2030-2100
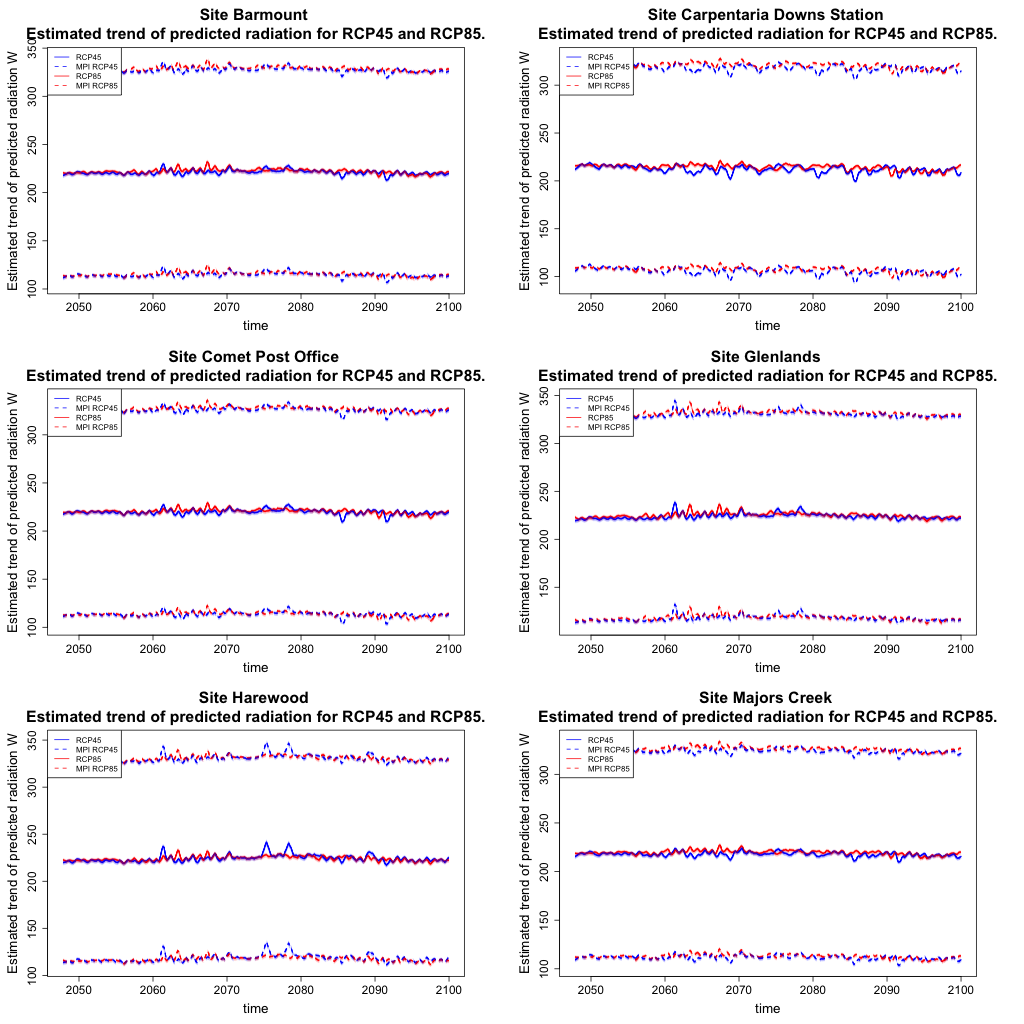
Figure 90 Estimated 12 month moving average of universal CNN-LSTMU projected radiation and \(\pm\) 95% MPI from 2050 to 2100 for profiles RCP4.5 and RCP8.5.
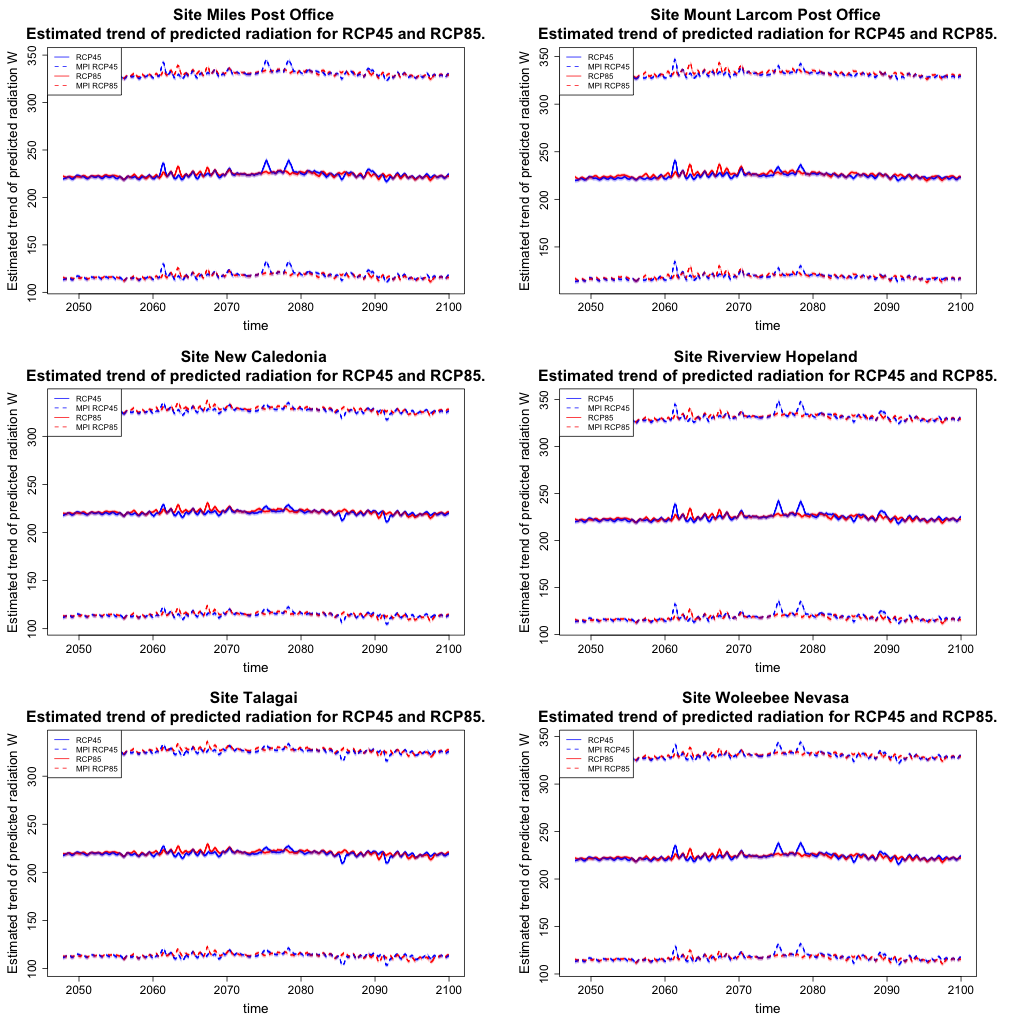
Figure 91 Estimated 12 month moving average of universal CNN-LSTMU projected radiation and \(\pm\) 95% MPI from 2050 to 2100 for profiles RCP4.5 and RCP8.5.
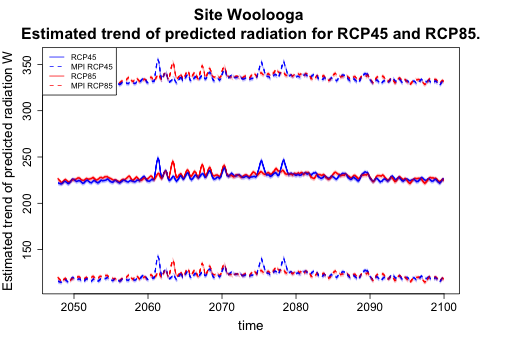
Figure 92 Estimated 12 month moving average of universal CNN-LSTMU projected radiation and \(\pm\) 95% MPI from 2050 to 2100 for profiles RCP4.5 and RCP8.5.

Downscaling Global Climate Models with Convolutional and Long-Short-Term Memory Networks for Solar Energy Applications by C.P. Davey is licensed under a Creative Commons Attribution-NonCommercial-ShareAlike 4.0 International License.