Chapter 5: Uncertainty of Models
Overview
After evaluation of model performance, the GLM model is selected as the baseline model in order to compare against the CNN-LSTML and CNN-LSTML DENSE models in the uncertainty assessment. The mean prediction interval (MPI) is calculated both on the test data set as well as for two RCP profiles, between the period 2006 and 2020, where observation data is available. The MPI provides a quantile estimate for the expected prediction interval for the corresponding quantile of the prediction. The prediction interval is taken as the mean difference between the upper and lower estimated bias at the corresponding quantile of the prediction.
Uncertainty Assessment of Proposed Local Model
The mean prediction interval of the test set for the GLM, CNN-LSTML and CNN-LSTML DENSE models is shown in Figure 54. The CNN-LSTML has 5.91\(Wm^{- 2}\) lower MPI at the 95% coverage probability of \(\pm 101.69Wm^{- 2}\) (or \(\pm 8.79MJm^{- 2}\text{da}y^{- 1}\)) in comparison to the GLM model at \(\pm 107.6Wm^{- 2}\) (or \(\pm 9.3MJm^{- 2}\text{da}y^{- 1}\)). The CNN-LSTML DENSE model has a similar 95% MPI to the GLM model of \(\pm 106.51Wm^{- 2}\) (or \(\pm 9.2MJm^{- 2}\text{da}y^{- 1}\)), however appears to have a lower MPI at lower prediction intervals.
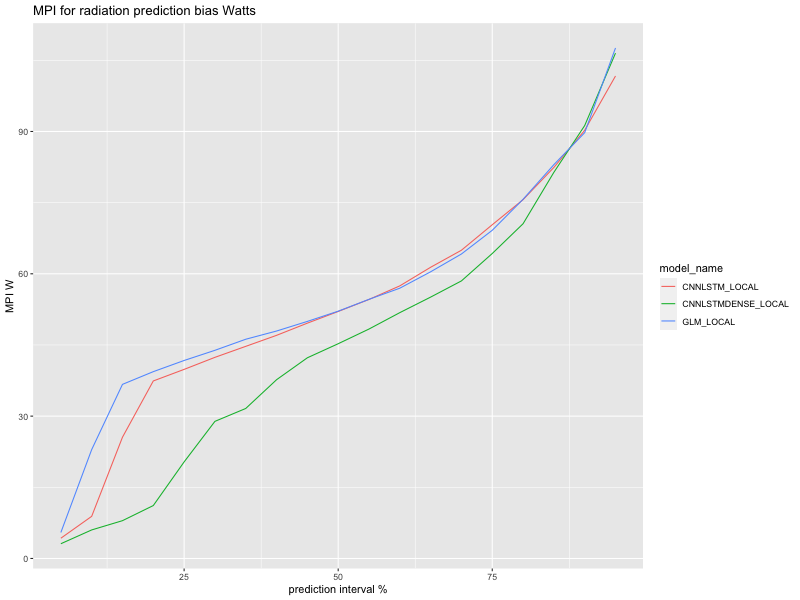
Figure 54 Mean Prediction Interval based on the test set for the selected models.
Table 28 Mean Prediction Interval for each model listed for each coverage probability.
| Coverage Probability | CNN-LSTML MPI \(\mathbf{W}\mathbf{m}^{\mathbf{- 2}}\) | CNN-LSTML DENSE MPI \(\mathbf{W}\mathbf{m}^{\mathbf{- 2}}\) | GLM MPI \(\mathbf{W}\mathbf{m}^{\mathbf{- 2}}\) |
|---|---|---|---|
| 5% | 4.27 | 3.11 | 5.47 |
| 10% | 8.88 | 6.01 | 22.94 |
| 15% | 25.56 | 7.97 | 36.70 |
| 20% | 37.41 | 11.15 | 39.38 |
| 25% | 39.85 | 20.35 | 41.73 |
| 30% | 42.39 | 28.90 | 43.87 |
| 35% | 44.71 | 31.61 | 46.21 |
| 40% | 47.03 | 37.67 | 47.94 |
| 45% | 49.60 | 42.30 | 49.97 |
| 50% | 52.06 | 45.26 | 52.12 |
| 55% | 54.59 | 48.36 | 54.62 |
| 60% | 57.46 | 51.81 | 56.97 |
| 65% | 61.38 | 55.09 | 60.42 |
| 70% | 64.97 | 58.50 | 64.18 |
| 75% | 70.34 | 64.28 | 69.17 |
| 80% | 75.63 | 70.55 | 75.70 |
| 85% | 82.42 | 81.39 | 83.01 |
| 90% | 90.25 | 91.24 | 89.75 |
| 95% | 101.69 | 106.51 | 107.60 |
The distance between the upper 97.5% and lower 2.5% quantiles of the bias in prediction is visualised in the scatter plot of the residual versus bias shown in Figure 55. The CNN-LSTML model exhibits slightly stronger correlation between prediction and bias under the test set and appears to have a slightly higher uncertainty in the prediction of upper extremes of radiation. The CNN-LSTML DENSE model has much higher non-uniform residual bias for the upper values of radiation, whereas the GLM model appears to have a slightly more uniform variance for the bias across the range of radiation.
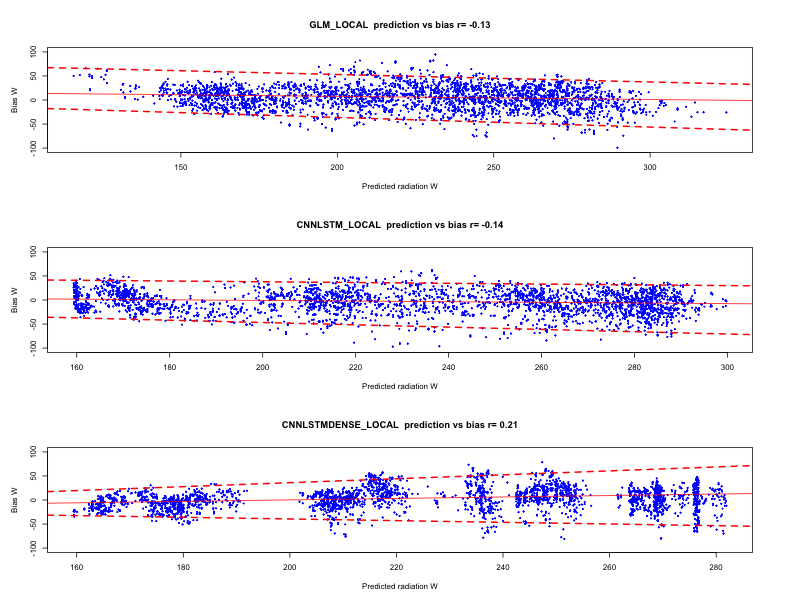
Figure 55 Upper and lower quantile regression at 2.5% and 97.5% for bias of predicted radiation in Watts for both models computed on the test set for site Barmount.
RCP4.5 2006 to 2020
The MPI for each local downscaling model for the RCP4.5 profile is shown in Figure 56. The CNN-LSTML exhibits lower MPI for the 95% probability coverage MPI of \(\pm 88.41Wm^{- 2}\) (or \(\pm 7.64MJm^{- 2}\text{da}y^{- 1}\)). In comparison the 95% probability coverage MPI for the GLM model is \(\pm 91.56Wm^{- 2}\) (\(\pm 7.91MJm^{- 2}\text{da}y^{- 1}\)) and \(\pm 91.24Wm^{- 2}\) (or \(\pm 7.88MJm^{- 2}\text{da}y^{- 1}\)) for the CNN-LSTML DENSE model.
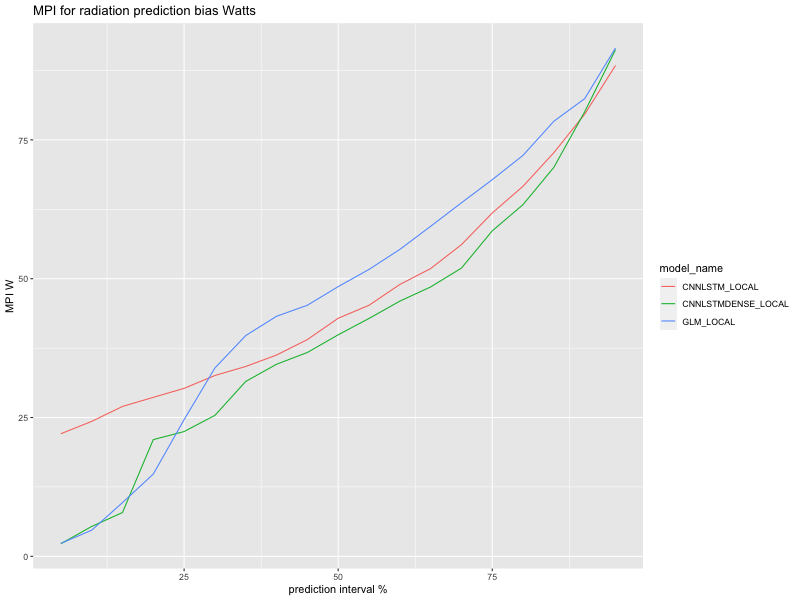
Figure 56 MPI for interval 2006 to 2020 for each model with profile RCP4.5.
p>Table 29 MPI for prediction coverage of selected models for RCP4.5 for period 2006-2020.| Coverage Probability | CNN-LSTML MPI \(\mathbf{W}\mathbf{m}^{\mathbf{- 2}}\) | CNN-LSTML DENSE MPI \(\mathbf{W}\mathbf{m}^{\mathbf{- 2}}\) | GLM MPI \(\mathbf{W}\mathbf{m}^{\mathbf{- 2}}\) |
|---|---|---|---|
| 5% | 22.08 | 2.27 | 2.34 |
| 10% | 24.30 | 5.38 | 4.70 |
| 15% | 27.00 | 7.89 | 9.68 |
| 20% | 28.63 | 21.02 | 14.82 |
| 25% | 30.26 | 22.47 | 24.62 |
| 30% | 32.57 | 25.39 | 33.92 |
| 35% | 34.20 | 31.50 | 39.76 |
| 40% | 36.25 | 34.60 | 43.23 |
| 45% | 39.04 | 36.71 | 45.22 |
| 50% | 42.88 | 39.90 | 48.57 |
| 55% | 45.21 | 42.84 | 51.67 |
| 60% | 48.96 | 45.96 | 55.28 |
| 65% | 51.83 | 48.52 | 59.44 |
| 70% | 56.13 | 51.91 | 63.67 |
| 75% | 61.84 | 58.62 | 67.83 |
| 80% | 66.66 | 63.35 | 72.22 |
| 85% | 72.71 | 70.06 | 78.36 |
| 90% | 79.63 | 80.06 | 82.43 |
| 95% | 88.41 | 91.24 | 91.56 |
The difference in the upper 97.5% and lower 2.5% bias of the prediction for each model under the RCP4.5 projection are shown in Figure 57. The GLM model exhibits a higher correlation between prediction and bias than the CNN-LSTML model, similarly, the correlation between prediction and bias is also larger in magnitude for the CNN-LSTML DENSE model. The interval of the bias increases in all models for higher values of predicted radiation indicating uncertainty in estimates of upper intervals of radiation, all models exhibit a degree of non-uniform variance in the residuals with the CNN-LSTML model exhibiting a less pronounced variation of residuals than the other two.
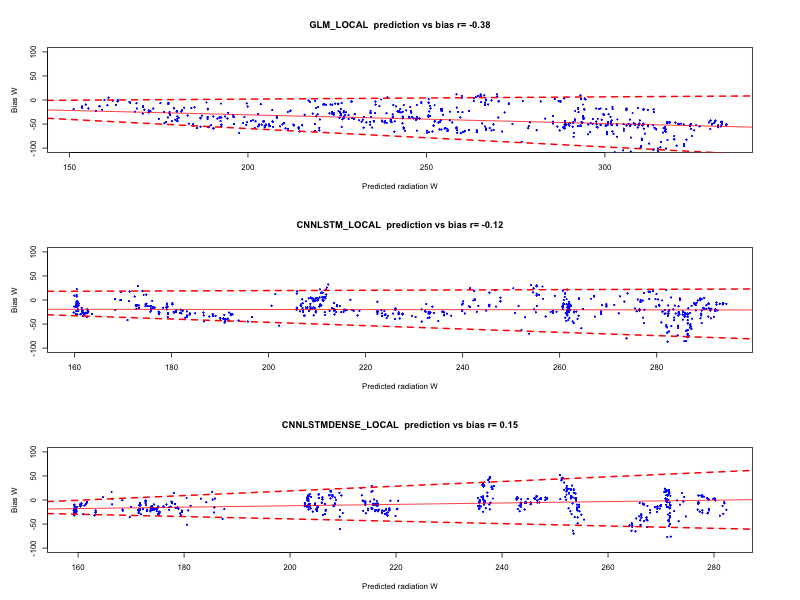
Figure 57 Quantile regression at 97.5% and 2.5% of bias for the RCP4.5 prediction error in both models at the Barmount site.
RCP8.5 2006 to 2020
The MPI for each model under the RCP8.5 profile is shown in Figure 58. For RCP8.5 the CNN-LSTML has a wider prediction interval than the GLM for the majority of coverage probability however has a lower MPI at the 95% probability coverage. The CNN-LSTML model has an MPI at the 95% coverage of \(\pm 87.44Wm^{- 2}\) (or \(\pm 7.55MJm^{- 2}\text{da}y^{- 1}\)), in comparison the GLM model has a 95% MPI of \(\pm 95.99Wm^{- 2}\) (\(\pm 8.29MJm^{- 2}\text{da}y^{- 1}\)) and the CNN-LSTML DENSE model has a 95% MPI of \(\pm 92.22Wm^{- 2}\) ($\(7.96\)m^{- 2}y^{- 1}$). The MPI is slightly smaller under the RCP8.5 model for the CNN-LSTML at the 95% coverage however is larger for the other models under this profile.
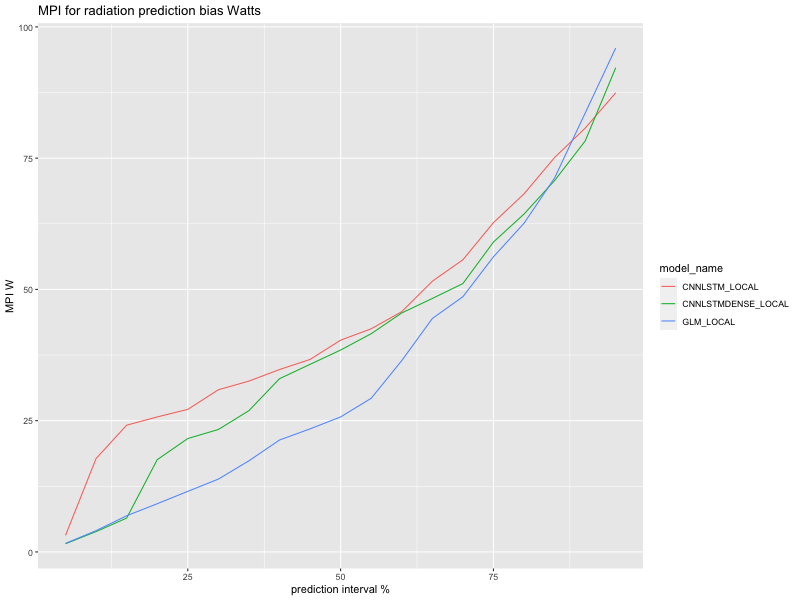
Figure 58 Mean Prediction Interval for each model under the RCP8.5 profile for data between 2006 and 2020.
Table 30 RCP8.5 Mean prediction interval for GLM and CNN-LSTM. The CNN-LSTM exhibits higher uncertainty for lower coverage probability, and less uncertainty at the 95% coverage probability than the GLM.
| Prediction Coverage | CNN-LSTML MPI \(\mathbf{W}\mathbf{m}^{\mathbf{- 2}}\) | CNN-LSTML DENSE MPI \(\mathbf{W}\mathbf{m}^{\mathbf{- 2}}\) | GLM MPI \(\mathbf{W}\mathbf{m}^{\mathbf{- 2}}\) |
|---|---|---|---|
| 5% | 3.16 | 1.57 | 1.63 |
| 10% | 17.80 | 3.88 | 4.06 |
| 15% | 24.14 | 6.45 | 6.89 |
| 20% | 25.71 | 17.57 | 9.18 |
| 25% | 27.15 | 21.60 | 11.54 |
| 30% | 30.89 | 23.32 | 13.87 |
| 35% | 32.54 | 26.91 | 17.36 |
| 40% | 34.74 | 33.00 | 21.32 |
| 45% | 36.66 | 35.73 | 23.44 |
| 50% | 40.34 | 38.45 | 25.71 |
| 55% | 42.50 | 41.57 | 29.27 |
| 60% | 45.76 | 45.52 | 36.45 |
| 65% | 51.56 | 48.28 | 44.46 |
| 70% | 55.65 | 51.12 | 48.61 |
| 75% | 62.72 | 59.02 | 56.22 |
| 80% | 68.20 | 64.36 | 62.60 |
| 85% | 75.12 | 70.73 | 71.23 |
| 90% | 80.71 | 78.27 | 83.58 |
| 95% | 87.44 | 92.22 | 95.99 |
The quantile regression of the bias in each of the model predictions are shown in Figure 59. The larger bias for the upper values of radiation are exhibited in all models under this profile, with the CNN-LSTML model appearing to over-estimate the upper values of radiation under the RCP8.5 profile. The correlation between the error and the prediction is lower for the CNN-LSTML model.
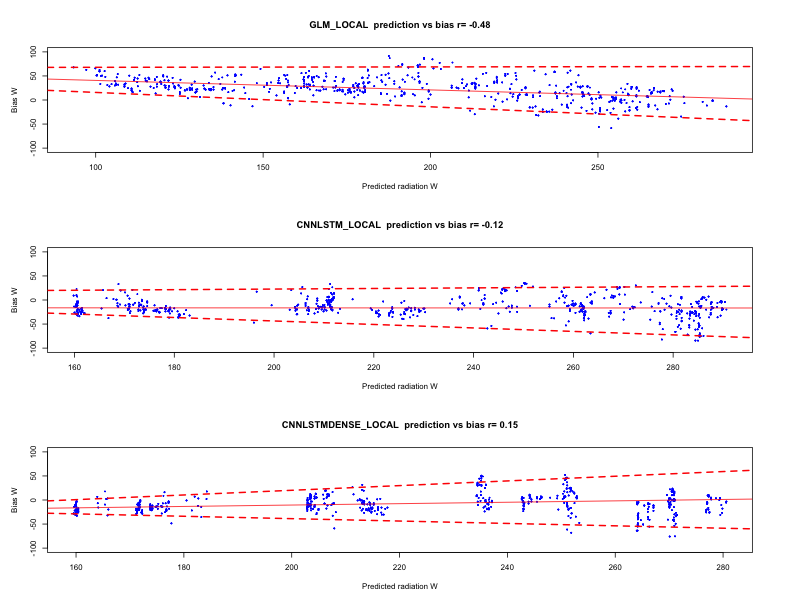
Figure 59 Quantile regression of prediction bias at the 97.5% and 2.5% intervals for both models under the RCP8.5 projection for global solar radiation at the Barmount site.

Downscaling Global Climate Models with Convolutional and Long-Short-Term Memory Networks for Solar Energy Applications by C.P. Davey is licensed under a Creative Commons Attribution-NonCommercial-ShareAlike 4.0 International License.