Chapter 5: Uncertainty of Models
Uncertainty Assessment of Proposed Universal Model
The universal CNN-LSTMU model demonstrates a consistently lower MPI in contrast to the GLM universal model for all coverage probabilities. The MPI at the 95% coverage probability for the CNN-LSTMU model is \(\pm 114.72Wm^{- 2}\) (or \(\pm 9.91MJm^{- 2}\text{da}y^{- 1}\)) in comparison to \(\pm 124.75Wm^{- 2}\) (or \(\pm 10.78MJm^{- 2}\text{da}y^{- 1}\)) for the GLM universal model.
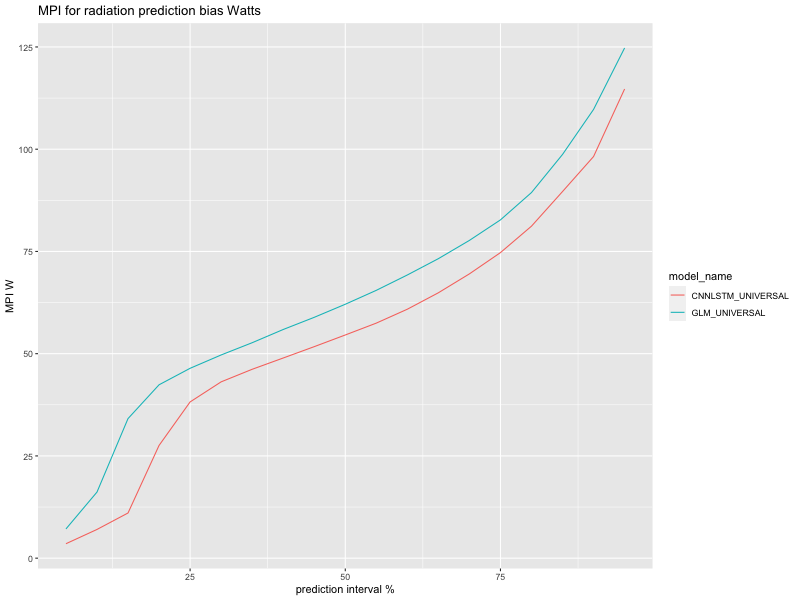
Figure 60 Comparison of the MPI for each of the universal models.
Table 31 Comparison of MPI for each of the universal models.
| Coverage Probability | CNN-LSTMU MPI \(\mathbf{W}\mathbf{m}^{- \mathbf{2}}\) | GLM MPI \(\mathbf{W}\mathbf{m}^{- \mathbf{2}}\) |
|---|---|---|
| 5% | 3.53 | 7.15 |
| 10% | 7.02 | 16.16 |
| 15% | 11.05 | 34.13 |
| 20% | 27.57 | 42.40 |
| 25% | 38.20 | 46.43 |
| 30% | 43.11 | 49.69 |
| 35% | 46.19 | 52.68 |
| 40% | 48.94 | 55.92 |
| 45% | 51.72 | 58.89 |
| 50% | 54.57 | 62.09 |
| 55% | 57.48 | 65.49 |
| 60% | 60.88 | 69.25 |
| 65% | 64.90 | 73.24 |
| 70% | 69.52 | 77.70 |
| 75% | 74.72 | 82.72 |
| 80% | 81.18 | 89.41 |
| 85% | 89.65 | 98.72 |
| 90% | 98.21 | 109.73 |
| 95% | 114.72 | 124.75 |
The plot of average prediction across all grid points versus the residuals for the GLM universal model at the Barmount site (Figure 61) indicates relatively low negative correlation of the prediction with the bias, where the model appears to overestimate upper values of radiation as well as indicating that the variance of the residuals appears to increase with respect to these values. The upper quantile remains relatively constant as the value of radiation increases, however the lower quantile for bias increases in value with the increase in radiation.
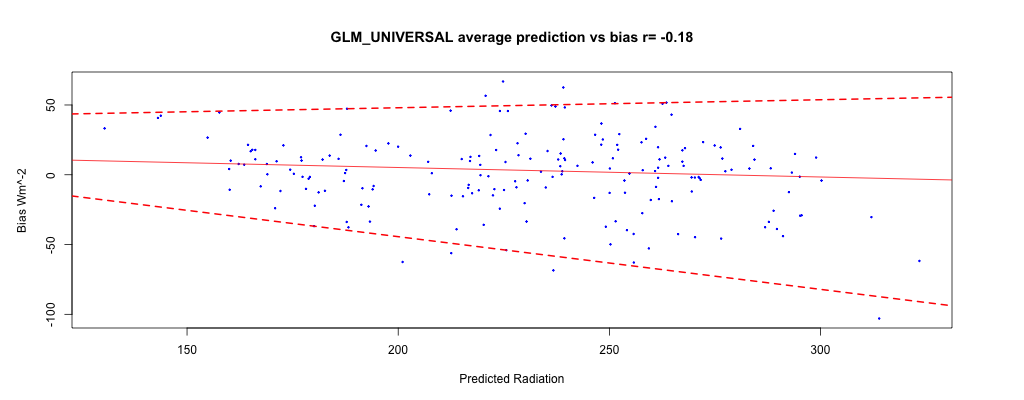
Figure 61 Upper and lower quantile regression at 2.5% and 97.5% for the average bias of the GLM universal model at the Barmount site.
The range of residuals span between -100\(\text{\ W}m^{- 2}\) (when the model over-estimates radiation) to 60\(Wm^{- 2}\)(where the model under-estimates radiation). The difference between the lower quantile for the bias and the residual is between 0 and 14\(Wm^{- 2}\) and is similar for between the upper quantile for the bias and the residual is between 0 and 13\(Wm^{- 2}\), shown in Figure 62. Months where the model over-estimates are visible in the figure where darker colours appear in the centre panel for January, February, March and November. Events where the model under-estimates are visible for months of January, February and November. The Largest differences with both the upper and lower quantiles for the bias are visible for March 1999. Higher levels of the residual occur in the summer months and in early autumn.
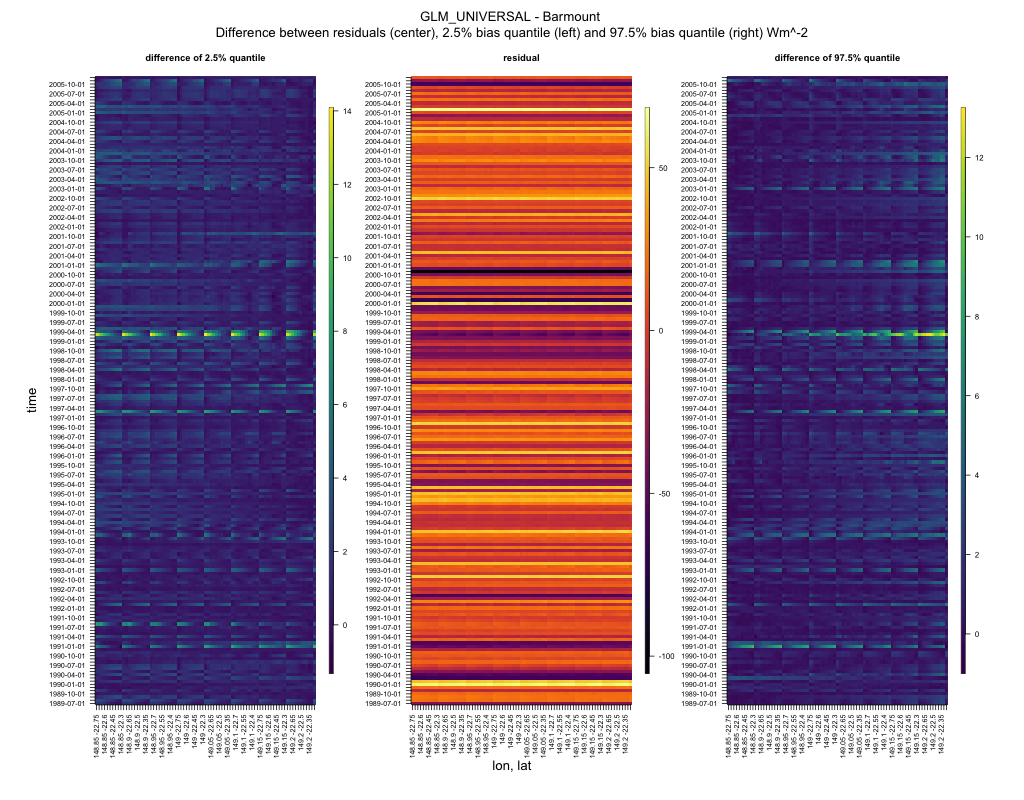
Figure 62 The difference between the residual, lower 2.5% and upper 97.5% quantile of bias for the GLM universal model at the Barmount site over time and grid point location.
Average residuals for the CNN-LSTMU model also exhibit non-uniform variance for higher values of radiation (Figure 63). The correlation between the predicted radiation and residuals is lower than the GLM model, at a small positive correlation of 0.07. Values for the average residuals span between -60 \(Wm^{- 2}\) and 60\(Wm^{- 2}\).
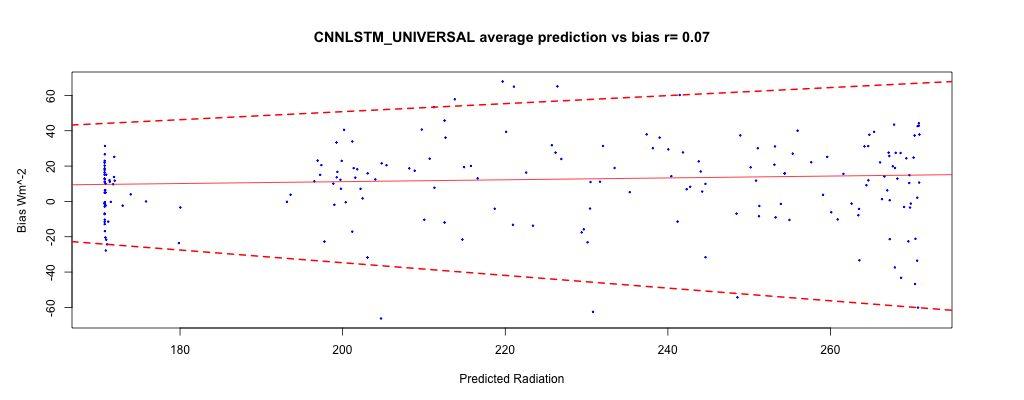
Figure 63 Upper and lower quantile regression at 2.5% and 97.5% for the average bias of the \(CNN - LSTM_{U}\) universal model at the Barmount site.
Extremes of the residual over time are visible in Figure 64, where the model over-estimates radiation are visible in the months of January, February, April and November. Higher values of the residual (where the model under-estimates) occur in the months of February and March. The largest differences between the lower and upper quantiles are visible for January, February, March, April of 1999. Both models exhibit highest extremes for errors in summer and early autumn.
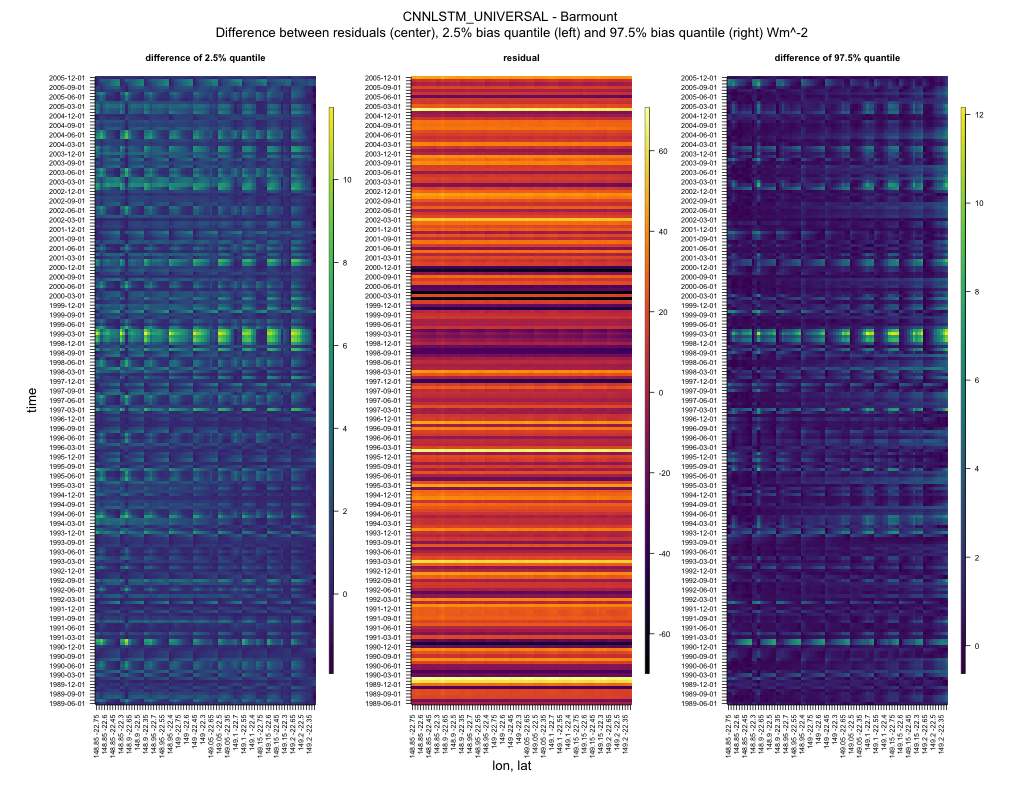
Figure 64 The difference between the residual, lower 2.5% and upper 97.5% quantile of bias for the CNN-LSTMU universal model at the Barmount site over time and grid point location.
RCP4.5 2006 to 2020
The MPI under RCP4.5 for the universal downscaling task indicates that the CNN-LSTMU model has a consistently lower MPI for all probability coverage percentages in comparison to the GLM model (illustrated in Figure 65). At the 95% coverage percentage the CNN-LSTMU has an MPI of \(\pm 106.2Wm^{- 2}\) (or \(\pm 9.18MJm^{- 2}\text{da}y^{- 1}\)) in comparison the GLM universal model has an MPI of \(\pm 118.45Wm^{- 2}\) (or \(\pm 10.23MJm^{- 2}\text{da}y^{- 1}\)).
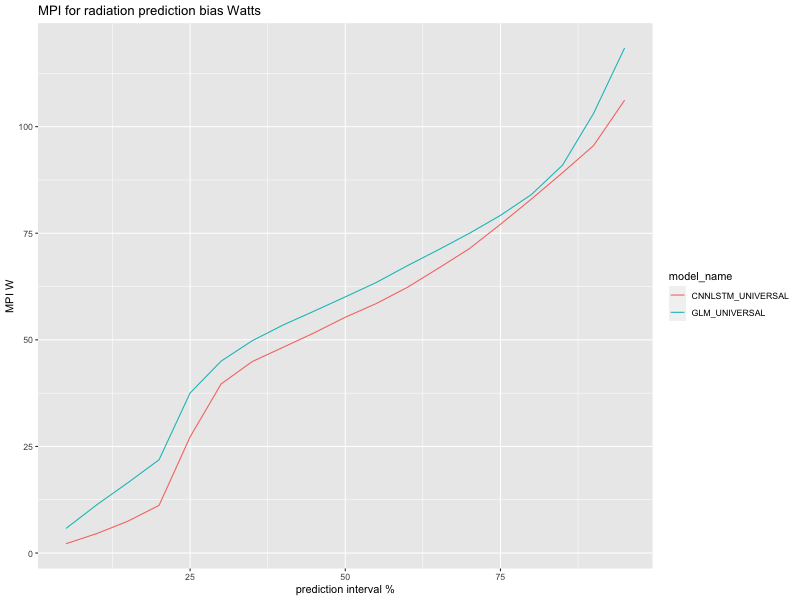
Figure 65 Mean Prediction Interval for universal downscaling task under the RCP4.5 climate warming scenario.
Table 32 List of coverage probabilities and MPI for both universal models under the RCP4.5 climate warming scenario.
| Coverage Probability | CNN-LSTMU MPI \(\mathbf{W}\mathbf{m}^{- \mathbf{2}}\) | GLM MPI \(\mathbf{W}\mathbf{m}^{- \mathbf{2}}\) |
|---|---|---|
| 5% | 2.19 | 5.76 |
| 10% | 4.58 | 11.35 |
| 15% | 7.48 | 16.51 |
| 20% | 11.18 | 21.88 |
| 25% | 27.24 | 37.53 |
| 30% | 39.66 | 45.01 |
| 35% | 44.90 | 49.79 |
| 40% | 48.27 | 53.49 |
| 45% | 51.65 | 56.75 |
| 50% | 55.30 | 60.07 |
| 55% | 58.52 | 63.46 |
| 60% | 62.31 | 67.38 |
| 65% | 66.79 | 71.12 |
| 70% | 71.40 | 74.99 |
| 75% | 77.10 | 79.19 |
| 80% | 83.03 | 84.09 |
| 85% | 89.20 | 90.97 |
| 90% | 95.55 | 103.10 |
| 95% | 106.20 | 118.45 |
Reviewing the scatter plot in Figure 66 for the average residuals and predictions, the GLM universal model exhibits a negative correlation between prediction and residual of -0.28 indicating over-estimation for the higher values of radiation. The range of the average residual spans between \(- 150Wm^{- 2}\) to \(20Wm^{- 2}\). The residuals appear to be uniformly distributed with the exception of an apparent outlier close to \(- 150Wm^{- 2}\), this influences the upper 97.5% and lower 2.5% regression quantiles for the bias with the lower bias being skewed towards the negative values as predicted radiation increases.
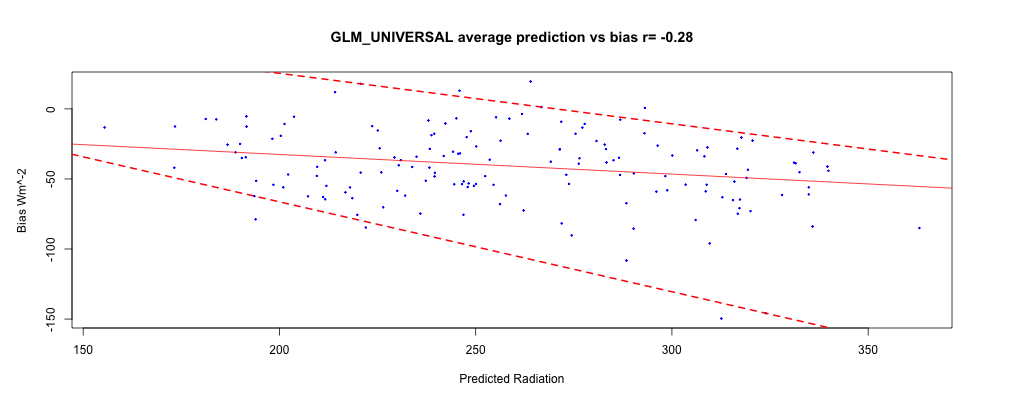
Figure 66 Quantile regression for the 2.5% and 97.5% quantiles of residuals for the GLM universal model at the Barmount site under the RCP4.5 climate warming scenario.
Inspecting the residuals over time and location, Figure 67 indicates the outlier for the residual occurred in November 2010 with other smaller events of negative bias occurring in the months of January, February, September and December. Upper values for the residual where the model under-estimated the radiation occur in the months of January, February, April and December. These events occur mostly during Summer and Autumn (with the exception of September 2016). The differences between the residual and the lower 2.5% bias quantile range between 0 and 10\(Wm^{- 2}\), while differences between the residual and the upper 97.5% bias quantile range between 0 and \(12Wm^{- 2}\). The largest differences with the both bias quantiles occur in the months of January, February, March and December. Mean error per month are shown in Figure 68 where the GLM model exhibits a range for the mean error between -51.31 \(Wm^{- 2}\) to -27.39\(\text{\ W}m^{- 2}\) with the largest values occurring in July, November and December.
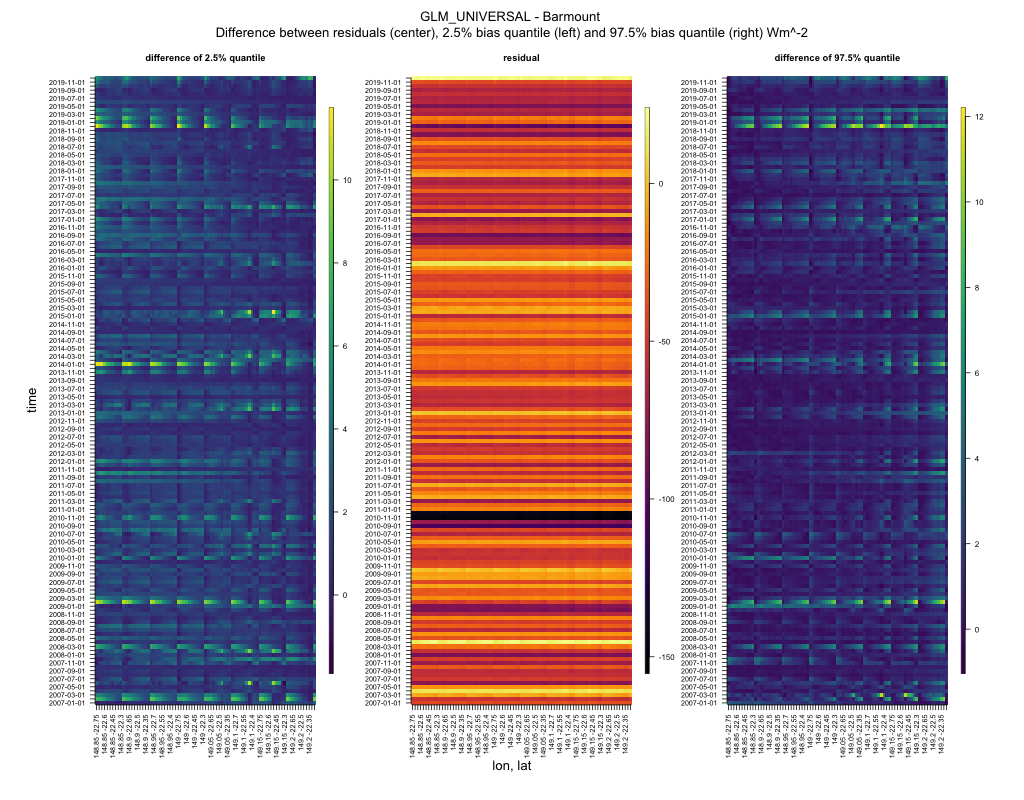
Figure 67 Residuals and the differences between the lower 2.5% and upper 97.5% estimated quantiles for residuals for the GLM universal model at the Barmount site under the RCP4.5 climate warming scenario.
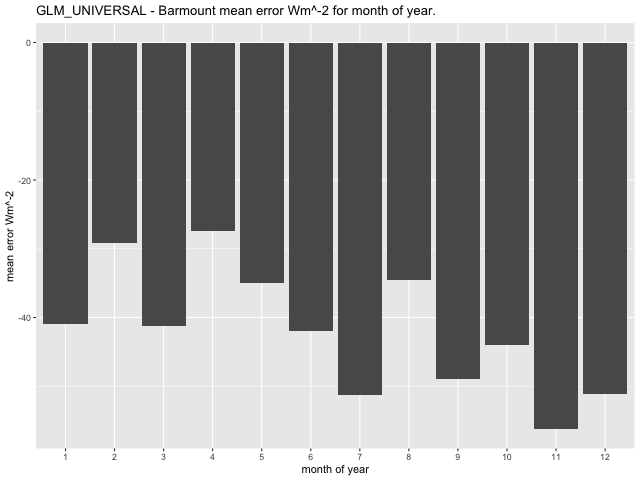
Figure 68 Mean error \(Wm^{- 2}\) per month for the GLM model at the Barmount observation site under the RCP4.5 climate warming scenario.
The residuals for the CNN-LSTMU model also appear to have a number of outliers and has a range between -107.35\(Wm^{- 2}\) and 37.65\(Wm^{- 2}\) shown in Figure 69. The correlation with predicted radiation is lower than the GLM model at 0.05. The lower 2.5% bias quantile is skewed towards over-estimation as the predicted radiation increases. There is a slight decrease in the upper 97.5% bias quantile as the predicted radiation increases.
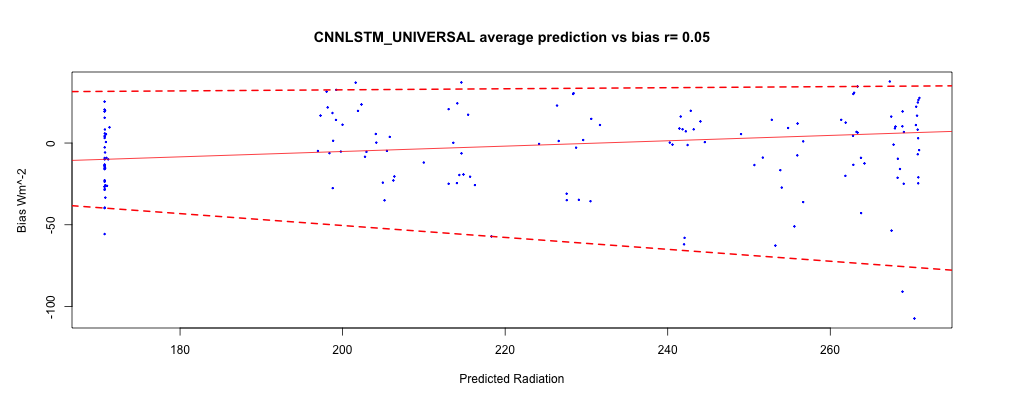
Figure 69 Quantile regression for the 2.5% and 97.5% quantiles of residuals for the CNN-LSTM universal model at the Barmount site under the RCP4.5 climate warming scenario.
The largest residuals for the over-estimation of radiation occur in November and December 2010 (Figure 70) with other smaller values for over-estimation occurring in the months of January, March, June and September. While events for larger under-estimates of radiation occur in the months of February, March, April, August, October, November and December. The correspondence to the summer months is not as consistent in this case. The differences between upper and lower residuals range between 0 and 10\(Wm^{- 2}\), and occur in the months of January, February, March, June and December. The average error per month is shown in Figure 71, average errors range between -23.68\(\text{\ W}m^{- 2}\) to 9.5\(\text{\ W}m^{- 2}\) with the largest average errors occurring in January and June.
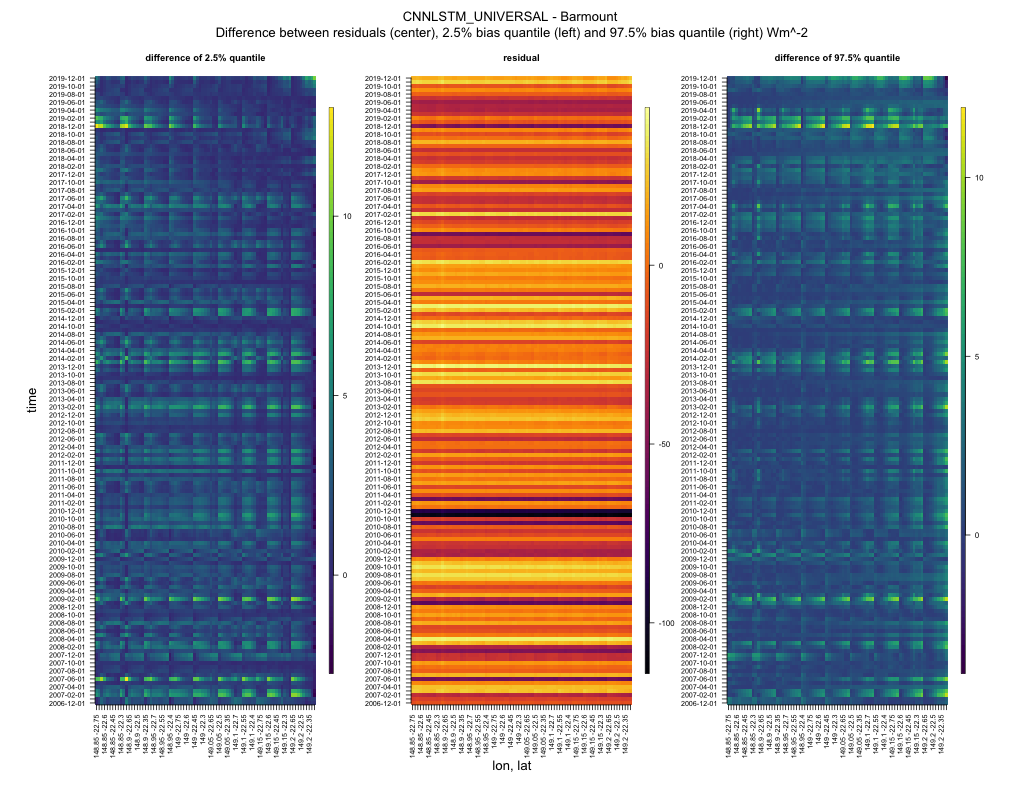
Figure 70 Residuals and the differences between the lower 2.5% and upper 97.5% estimated quantiles for residuals for the CNN-LSTMU model at the Barmount site under the RCP4.5 climate warming scenario.
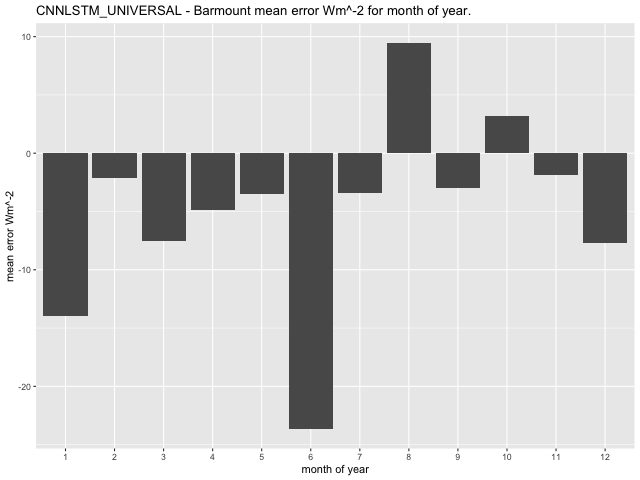
Figure 71 Mean error \(Wm^{- 2}\) per month for the CNN-LSTMU model at the Barmount observation site under the RCP4.5 climate warming scenario.
RCP8.5 2006 to 2020
The MPI of the CNN-LSTMU universal model is also consistently lower than that of the GLM universal model under the RCP8.5 climate warming scenario, demonstrated in Figure 72. At the 95% probability coverage the CNN-LSTMU has an MPI of \(\pm 106.07Wm^{- 2}\) \(( \pm 9.16MJm^{- 2}\text{da}y^{- 1}\)) opposed to the GLM model MPI of \(\pm 122.76Wm^{- 2}\) \(( \pm 10.61MJm^{- 2}\text{da}y^{- 1}\)).
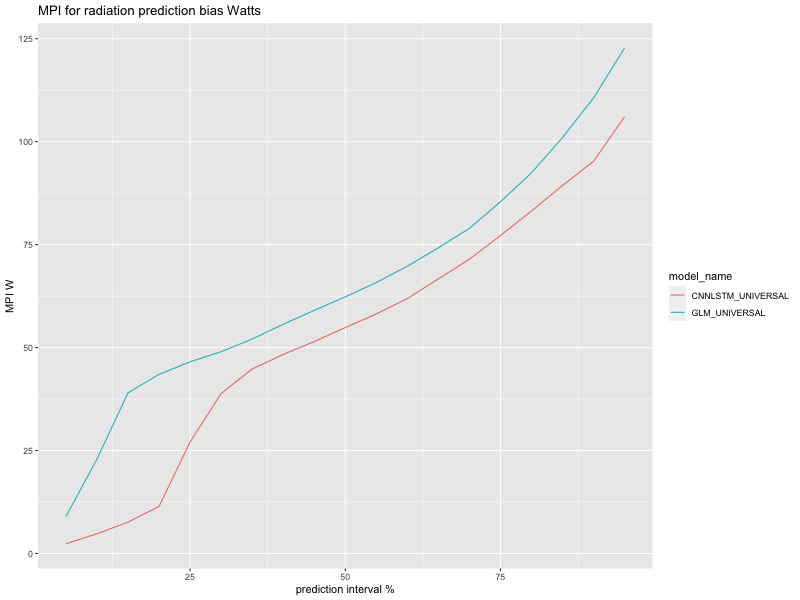
Figure 72 Mean Prediction Interval for universal models under the RCP8.5 climate warming scenario.
Table 33 MPI for prediction coverage of universal models for RCP8.5 for period 2006-2020.
| Prediction Coverage | CNN-LSTMU MPI \(\mathbf{W}\mathbf{m}^{\mathbf{- 2}}\) | GLM MPI \(\mathbf{W}\mathbf{m}^{\mathbf{- 2}}\) |
|---|---|---|
| 5% | 2.37 | 8.97 |
| 10% | 4.78 | 22.93 |
| 15% | 7.60 | 39.03 |
| 20% | 11.43 | 43.50 |
| 25% | 27.07 | 46.55 |
| 30% | 38.85 | 49.00 |
| 35% | 44.80 | 52.07 |
| 40% | 48.33 | 55.67 |
| 45% | 51.48 | 59.03 |
| 50% | 54.86 | 62.32 |
| 55% | 58.17 | 65.80 |
| 60% | 61.91 | 69.76 |
| 65% | 66.69 | 74.23 |
| 70% | 71.46 | 78.96 |
| 75% | 77.21 | 85.40 |
| 80% | 83.16 | 92.44 |
| 85% | 89.36 | 101.02 |
| 90% | 95.24 | 110.63 |
| 95% | 106.07 | 122.76 |
The average residuals of the GLM model at the Barmount site under the RCP8.5 climate warming scenario span between -110 \(Wm^{- 2}\) to 50\(\text{\ W}m^{- 2}\), an outlier is visible close to -110 \(Wm^{- 2}\) in Figure 73. The prediction has a slight negative correlation with the residual of -0.17, and the negative correlation appears more pronounced in lower 2.5% bias quantile where the quantile increases with the value of the prediction. The upper 97.5% quantile does not appear to decline as dramatically. The bias quantiles are lower in magnitude in comparison to the RCP4.5 quantile estimates.
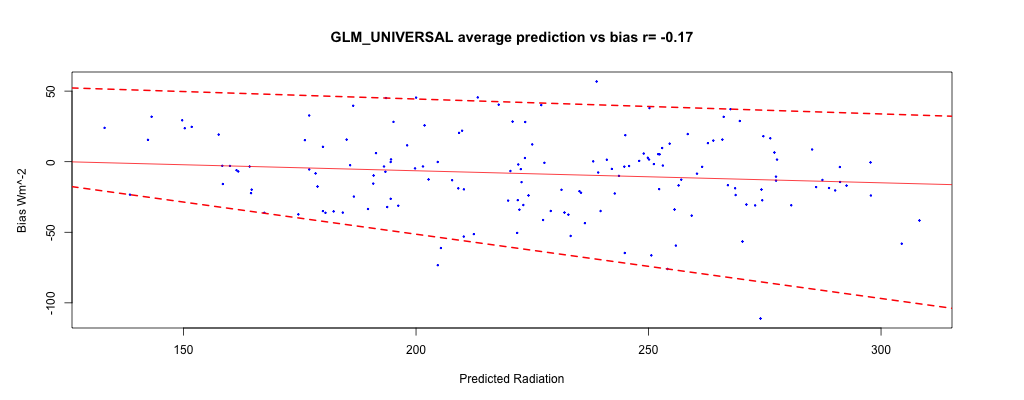
Figure 73 Quantile regression for the 2.5% and 97.5% quantiles of residuals for the GLM universal model at the Barmount site under the RCP8.5 climate warming scenario.
The residuals over time span between -\(115Wm^{- 2}\) and 60\(Wm^{- 2}\) and the difference between the residual and the lower bias quantile lies between -5\(\text{\ W}m^{- 2}\) and 15\(\text{\ W}m^{- 2}\) while the difference with the upper bias quantile is within the range of -5\(\text{\ W}m^{- 2}\) to 20\(\text{\ W}m^{- 2}\). The GLM model appears to over-estimate values of radiation for months January, March, June, July, September, November and December (Figure 74). Whereas the GLM under-estimates radiation in the months for January, February, April, November and December. Events where there are larger differences between the residual and the 2.5% bias quantile occur in the months of January, February, March and December. Larger differences with the upper 97.5% quantile include January, February, March, November and December. The majority of events occurring within summer and autumn months with the exception of June, July and September. Figure 75 illustrates the mean error per month of year under the RCP8.5 scenario, the larger mean for the errors occur within the winter months of the year. The average error has a range between -23.28\(Wm^{- 2}\) and 3.25\(Wm^{- 2}\) with the largest mean error occurring in July.
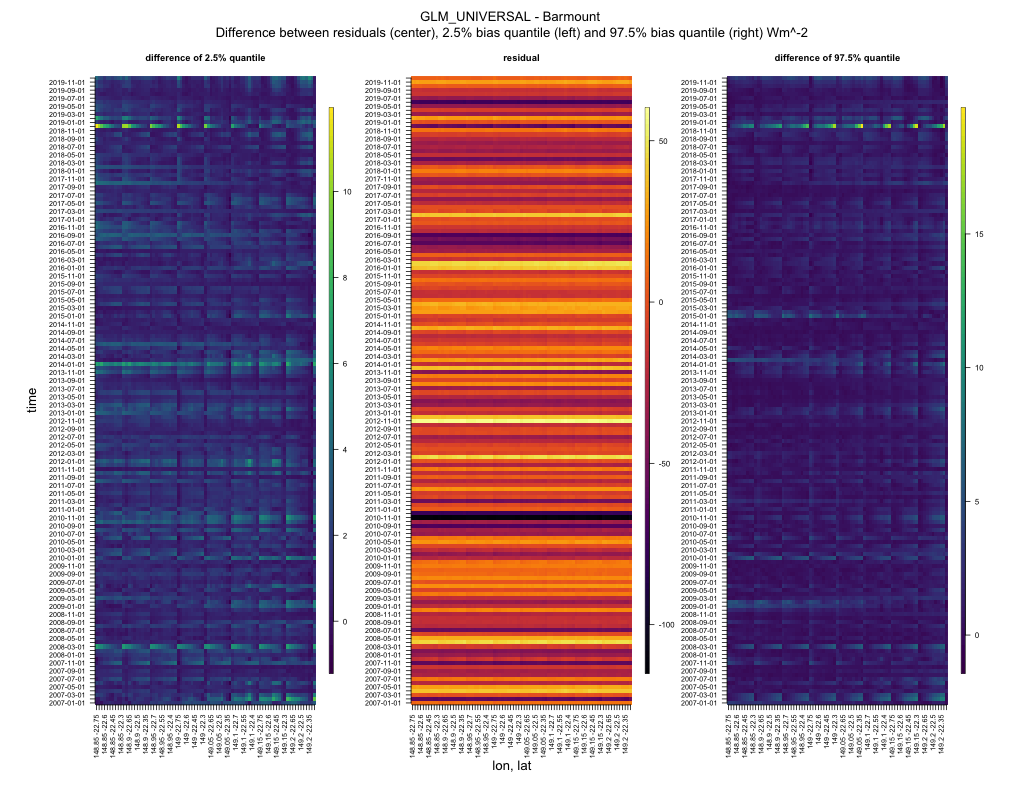
Figure 74 Residuals and the differences between the lower 2.5% and upper 97.5% estimated quantiles for residuals for the GLM universal model at the Barmount site under the RCP8.5 climate warming scenario.
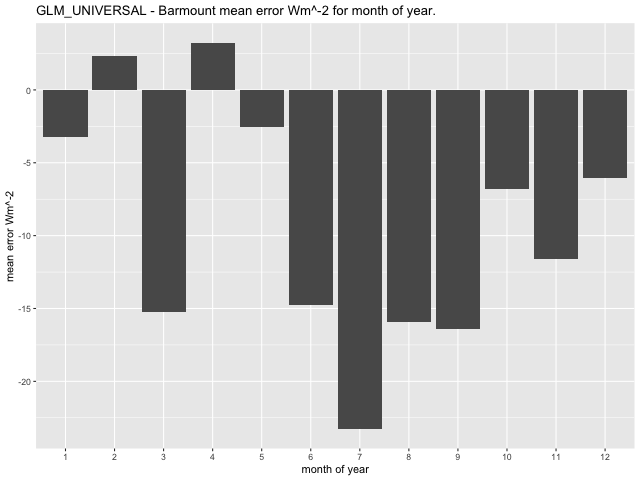
Figure 75 Mean error \(Wm^{- 2}\) per month for the GLM model at the Barmount observation site under the RCP8.5 climate warming scenario.
The CNN-LSTMU model is similarly biased towards over-estimation for radiation under this climate warming scenario, as average residuals span between -110 \(Wm^{-}2\) and 40\(Wm^{-}2\).
Correlation between the prediction and the residual is low at 0.05, however there is a negative trend between the lower 2.5% bias quantile and the residuals as evident in \(\ REF\ \_ Ref52114236\ \backslash h\ \)Figure 76 reflecting the over-estimated values. The model less frequently underestimates values of radiation as the upper 97.5% bias quantile does not appear to change with the prediction.
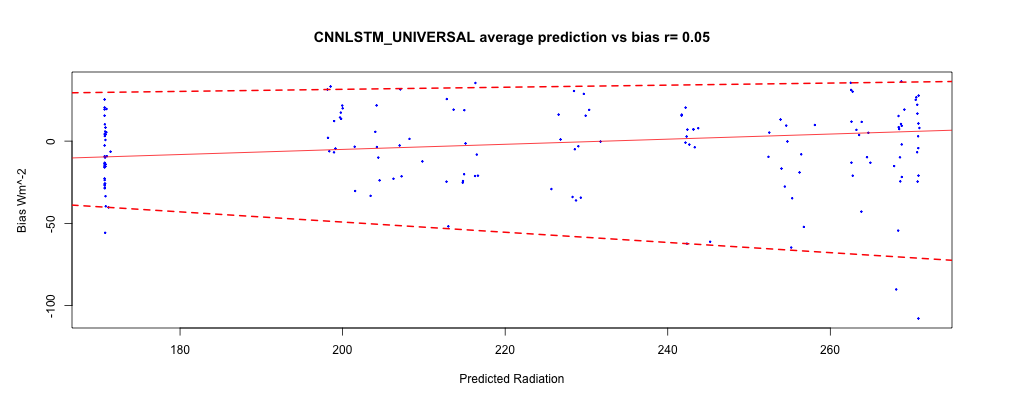
Figure 76 Quantile regression for the 2.5% and 97.5% quantiles of residuals for the CNN-LSTMU universal model at the Barmount site under the RCP8.5 climate warming scenario.
Events where the model over-estimates the radiation occur in months of January, March, June, September, October, November and December (visible in Figure 77). The model under-estimates radiation more frequently with events occurring in January, February, March, April, August, September, October and December. Larger differences between the residual and the bias quantiles occur in months January, February, March, June, November and December. With the exception of June and September most events appear to occur in summer and early august. The differences between the residual and bias quantiles lies within the range of -5\(\text{\ W}m^{- 2}\) and 15\(\text{\ W}m^{- 2}\). The largest average mean error per month occur in January and June as shown in Figure 78, with a range between -23.72\(\text{\ W}m^{- 2}\) and 9.05\(\text{\ W}m^{- 2}\).
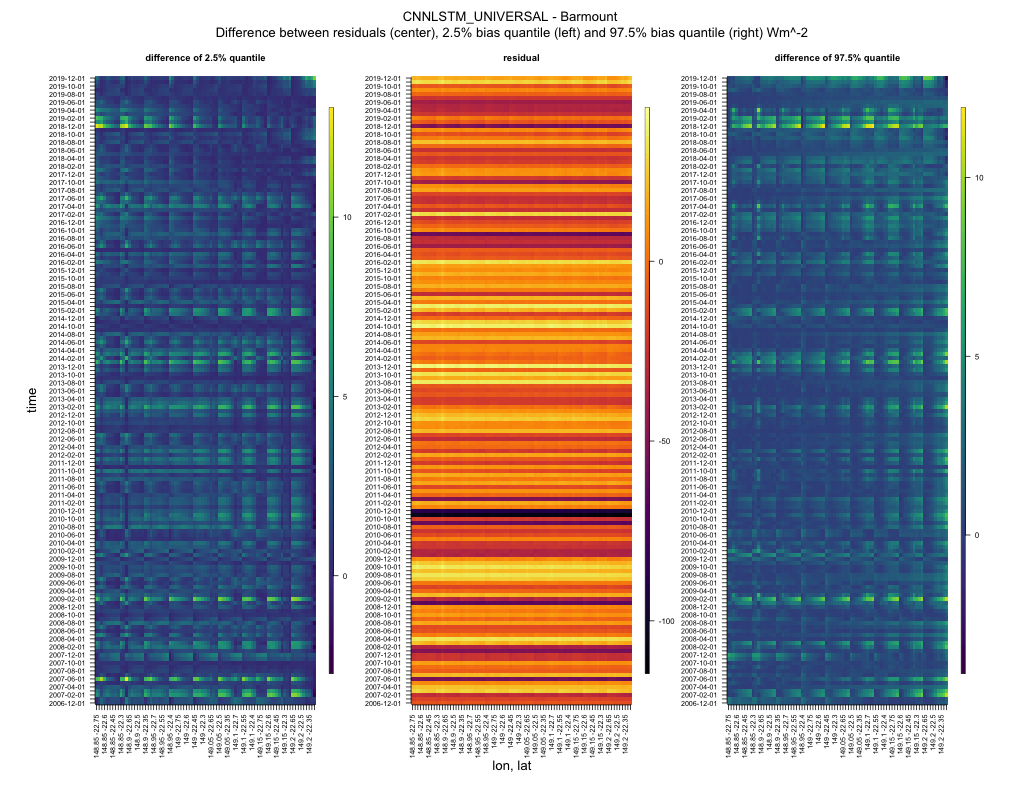
Figure 77 Residuals and the differences between the lower 2.5% and upper 97.5% estimated quantiles for residuals for the CNN-LSTMU universal model at the Barmount site under the RCP8.5 climate warming scenario.
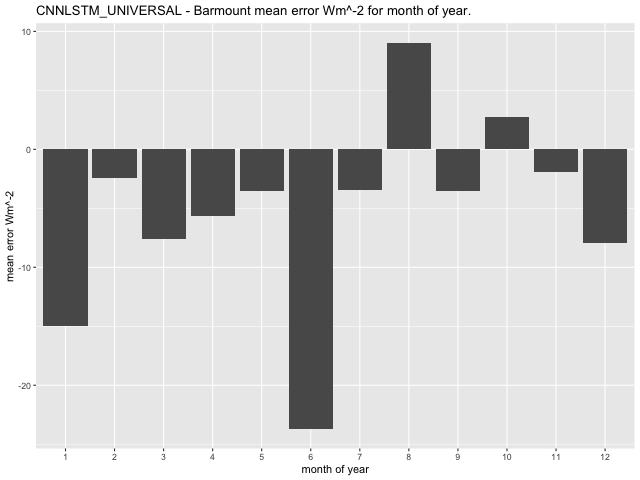
Figure 78 Mean error \(Wm^{- 2}\) per month for the CNN-LSTMU model at the Barmount observation site under the RCP8.5 climate warming scenario

Downscaling Global Climate Models with Convolutional and Long-Short-Term Memory Networks for Solar Energy Applications by C.P. Davey is licensed under a Creative Commons Attribution-NonCommercial-ShareAlike 4.0 International License.