Chapter 6: Projection Under Representative Climate Pathways
Overview
In this chapter the resulting CNN-LSTM models for both the local and the universal downscaling tasks are used to produce projections for global solar radiation under the two representative concentration pathways for RCP4.5 and RCP8.5. Average differences between the projections are quantified per decade and a comparison is made between in order to determine whether there is agreement between the two downscaling methods for the trend in the change of solar availability over the current century.
Local Model Projection
The projections of average monthly radiation under RCP4.5 and RCP8.5 were generated using the CNN-LSTML model. The prediction interval is estimated from the MPI for each profile and included in the projection for each site. Projections indicate a slightly higher availability of global solar radiation under the RCP4.5 profile as opposed to the RCP8.5 profile.
The prediction for Comet Post Office and Majors Creek are shown in Figure 79 and Figure 82. The upper and lower limits depict the estimate of the MPI at the 95% probability coverage derived from each profile for the data available between 2006 to 2020. The range of radiation is between 160\(Wm^{- 2}\) and 295\(\text{\ W}m^{- 2}\) for RCP4.5 and between 160\(\text{\ W}m^{- 2}\) and 296\(\text{\ W}m^{- 2}\) for RCP8.5. A slight decrease under RCP8.5 corresponding to the decade is noticable in the difference between profiles from 2030 to 2090 in Figure 80 and Figure 82 where the distribution of differences in predicted radiation extend toward the right hand side of the histogram in each of those decades. The span between 2090 and 2100 indicates that predictions under RCP8.5 exceed those of RCP4.5 during that decade at both sites. The average estimated values for radiation at the Comet Post Office site under the RCP8.5 scenario are slightly less than the average estimated values for radiation under the RCP4.5 scenario with the exception being the final decade of 2100 (Table 34, Table 35 and
Table 36). There is a similar difference observable for the Majors Creek site, however the minimum average values for the RCP8.5 scenario are only slightly larger than the average estimated radiation for RCP4.5 (Table 37). The mean and maximum average values for RCP8.5 remain less than those of RCP4.5 until 2100 (Table 38 and Table 39).
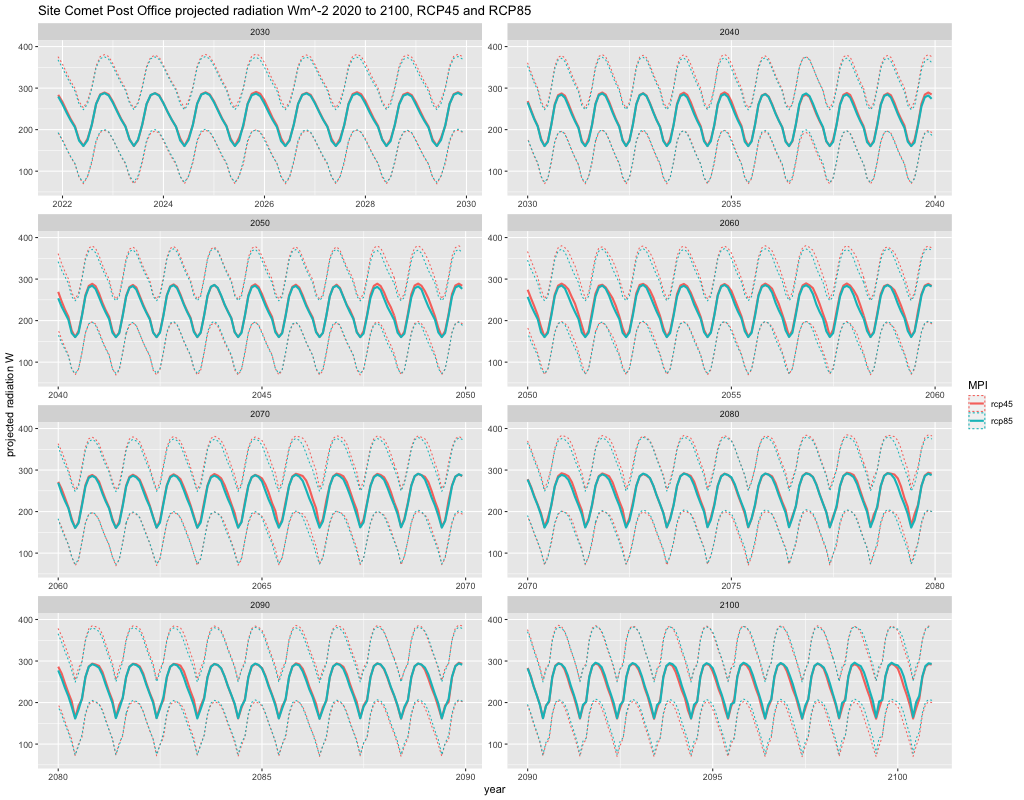
Figure 79 Predicted radiation between 2020 and 2100 under RCP4.5 and RCP8.5 climate warming scenario for the site Comet Post Office. The unshaded area shows the 95% mean prediction interval.
Table 34 Average predicted values for \(\pm 95\%\) MPI and predicted radiation \(\widehat{r}\) \(Wm^{- 2}\) for the minimum values per decade under RCP4.5 and RCP8.5 scenarios at Comet Post Office. The difference between RCP4.5 and RCP8.5 is shown for the MPI (\(\Delta\) \(\pm 95\%\) MPI) as well as for the mean estimated radiation \(\Delta\widehat{r}\).
|
RCP4.5 Minimum (average) \(\mathbf{W}\mathbf{m}^{- \mathbf{2}}\) |
RCP8.5 Minimum (average) \(\mathbf{W}\mathbf{m}^{- \mathbf{2}}\) |
Difference \(\mathbf{W}\mathbf{m}^{- \mathbf{2}}\) | |||||||
|---|---|---|---|---|---|---|---|---|---|
| Decade | -MPI | \[\widehat{\mathbf{r}}\] | +MPI | -MPI | \[\widehat{\mathbf{r}}\] | +MPI | \(\mathbf{\Delta}\) -MPI | \[\mathbf{\Delta}\widehat{\mathbf{r}}\] | \(\mathbf{\Delta}\) +MPI |
| 2030 | 69.27 | 160.51 | 251.75 | 73.02 | 160.46 | 247.90 | -3.75 | 0.05 | 3.85 |
| 2040 | 69.01 | 160.25 | 251.49 | 72.87 | 160.31 | 247.75 | -3.86 | -0.06 | 3.74 |
| 2050 | 68.95 | 160.19 | 251.43 | 72.74 | 160.18 | 247.62 | -3.80 | 0.00 | 3.80 |
| 2060 | 69.29 | 160.53 | 251.77 | 72.72 | 160.16 | 247.60 | -3.43 | 0.37 | 4.17 |
| 2070 | 69.56 | 160.80 | 252.04 | 73.28 | 160.72 | 248.16 | -3.72 | 0.08 | 3.88 |
| 2080 | 70.63 | 161.87 | 253.11 | 74.02 | 161.46 | 248.90 | -3.39 | 0.41 | 4.21 |
| 2090 | 70.11 | 161.35 | 252.59 | 73.39 | 160.83 | 248.27 | -3.28 | 0.52 | 4.32 |
| 2100 | 69.62 | 160.86 | 252.10 | 74.20 | 161.64 | 249.08 | -4.58 | -0.78 | 3.02 |
Table 35 Average predicted values for \(\pm 95\%\) MPI and predicted radiation \(\widehat{r}\) \(Wm^{- 2}\) for the mean values per decade under RCP4.5 and RCP8.5 scenarios at Comet Post Office. The difference between RCP4.5 and RCP8.5 is shown for the MPI (\(\Delta\) \(\pm 95\%\) MPI) as well as for the mean estimated radiation \(\Delta\widehat{r}\).
|
RCP4.5 Mean \(\mathbf{W}\mathbf{m}^{- \mathbf{2}}\) |
RCP8.5 Mean \(\mathbf{W}\mathbf{m}^{- \mathbf{2}}\) |
Difference \(\mathbf{W}\mathbf{m}^{- \mathbf{2}}\) | |||||||
|---|---|---|---|---|---|---|---|---|---|
| Decade | -MPI | \[\widehat{\mathbf{r}}\] | +MPI | -MPI | \[\widehat{\mathbf{r}}\] | +MPI | \(\mathbf{\Delta}\) -MPI | \[\mathbf{\Delta}\widehat{\mathbf{r}}\] | \(\mathbf{\Delta}\) +MPI |
| 2030 | 142.21 | 233.45 | 324.69 | 143.78 | 231.22 | 318.66 | -1.57 | 2.23 | 6.03 |
| 2040 | 140.28 | 231.52 | 322.76 | 141.50 | 228.94 | 316.38 | -1.22 | 2.58 | 6.38 |
| 2050 | 140.03 | 231.27 | 322.51 | 139.69 | 227.13 | 314.57 | 0.34 | 4.14 | 7.94 |
| 2060 | 145.13 | 236.37 | 327.61 | 141.68 | 229.12 | 316.56 | 3.45 | 7.25 | 11.05 |
| 2070 | 149.42 | 240.66 | 331.90 | 147.79 | 235.23 | 322.67 | 1.63 | 5.43 | 9.23 |
| 2080 | 151.93 | 243.17 | 334.41 | 152.43 | 239.87 | 327.31 | -0.49 | 3.31 | 7.11 |
| 2090 | 151.02 | 242.26 | 333.50 | 152.74 | 240.18 | 327.62 | -1.72 | 2.08 | 5.88 |
| 2100 | 147.15 | 238.39 | 329.63 | 155.60 | 243.04 | 330.48 | -8.45 | -4.65 | -0.85 |
Table 36 Average predicted values for \(\pm 95\%\) MPI and predicted radiation \(\widehat{r}\) \(Wm^{- 2}\) for the maximum values per decade under RCP4.5 and RCP8.5 scenarios at Comet Post Office. The difference between RCP4.5 and RCP8.5 is shown for the MPI (\(\Delta\) \(\pm 95\%\) MPI) as well as for the mean estimated radiation \(\Delta\widehat{r}\).
|
RCP4.5 Maximum (average) \(\mathbf{W}\mathbf{m}^{- \mathbf{2}}\) |
RCP8.5 Maximum (average) \(\mathbf{W}\mathbf{m}^{- \mathbf{2}}\) |
Difference \(\mathbf{W}\mathbf{m}^{- \mathbf{2}}\) | |||||||
|---|---|---|---|---|---|---|---|---|---|
| Decade | -MPI | \[\widehat{\mathbf{r}}\] | +MPI | -MPI | \[\widehat{\mathbf{r}}\] | +MPI | \(\mathbf{\Delta}\) -MPI | \[\mathbf{\Delta}\widehat{\mathbf{r}}\] | \(\mathbf{\Delta}\) +MPI |
| 2030 | 199.56 | 290.80 | 382.04 | 201.21 | 288.65 | 376.09 | -1.65 | 2.15 | 5.95 |
| 2040 | 198.54 | 289.78 | 381.02 | 199.75 | 287.19 | 374.63 | -1.20 | 2.60 | 6.40 |
| 2050 | 197.92 | 289.16 | 380.40 | 198.34 | 285.78 | 373.22 | -0.43 | 3.37 | 7.17 |
| 2060 | 198.49 | 289.73 | 380.97 | 198.77 | 286.21 | 373.65 | -0.28 | 3.52 | 7.32 |
| 2070 | 200.11 | 291.35 | 382.59 | 203.52 | 290.96 | 378.40 | -3.41 | 0.39 | 4.19 |
| 2080 | 202.30 | 293.54 | 384.78 | 204.75 | 292.19 | 379.63 | -2.45 | 1.35 | 5.15 |
| 2090 | 204.53 | 295.77 | 387.01 | 206.83 | 294.27 | 381.71 | -2.29 | 1.51 | 5.31 |
| 2100 | 203.55 | 294.79 | 386.03 | 208.61 | 296.05 | 383.49 | -5.06 | -1.26 | 2.54 |
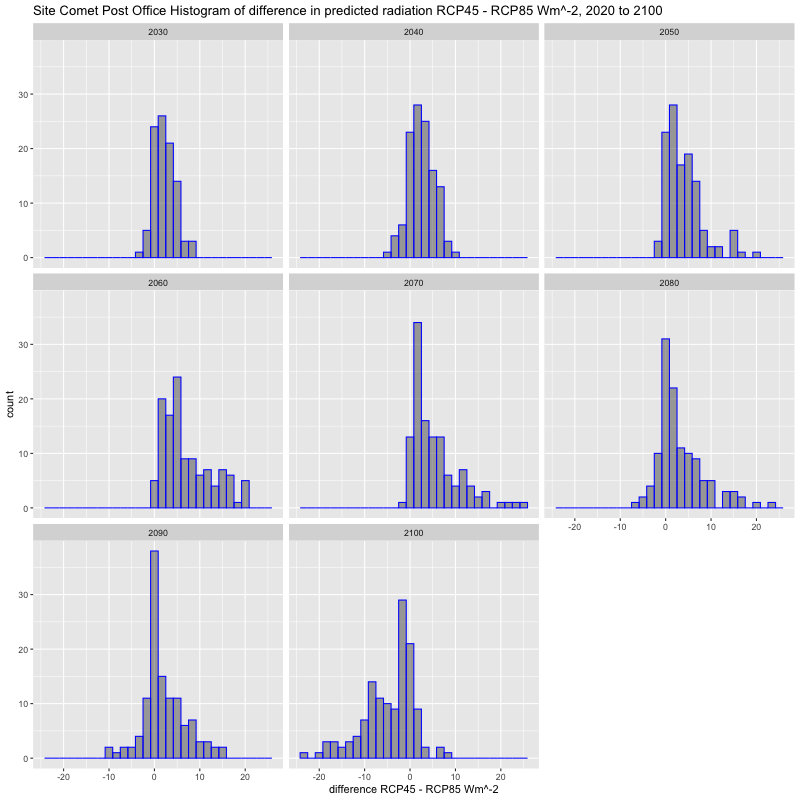
Figure 80 Differences between mean predicted radiation for profiles RCP4.5 and RCP8.5 at Comet Post Office for decades between 2020 and 2100.
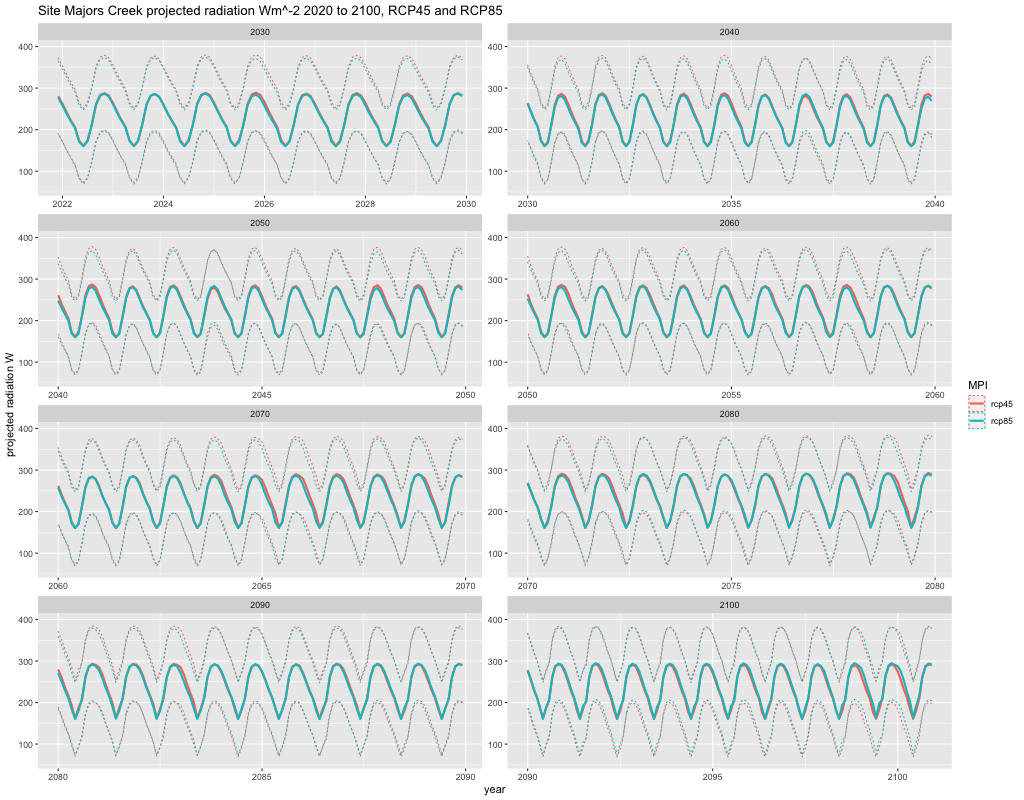
Figure 81 Predicted average monthly radiation for 2020 to 2100 at the observation site of Majors Creek for both RCP4.5 and RCP8.5 climate warming scenario. The unshaded area shows the 95% mean prediction interval.
Table 37 Average predicted values for \(\pm 95\%\) MPI and predicted radiation \(\widehat{r}\) \(Wm^{- 2}\) for the minimum values per decade under RCP4.5 and RCP8.5 scenarios at Majors Creek. The difference between RCP4.5 and RCP8.5 is shown for the MPI (\(\Delta\) \(\pm 95\%\) MPI) as well as for the mean estimated radiation \(\Delta\widehat{r}\).
|
RCP4.5 Minimum (average) \(\mathbf{W}\mathbf{m}^{- \mathbf{2}}\) |
RCP8.5 Minimum (average) \(\mathbf{W}\mathbf{m}^{- \mathbf{2}}\) |
Difference \(\mathbf{W}\mathbf{m}^{- \mathbf{2}}\) | |||||||
|---|---|---|---|---|---|---|---|---|---|
| Decade | -MPI | \[\widehat{\mathbf{r}}\] | +MPI | -MPI | \[\widehat{\mathbf{r}}\] | +MPI | \(\mathbf{\Delta}\) -MPI | \[\mathbf{\Delta}\widehat{\mathbf{r}}\] | \(\mathbf{\Delta}\) +MPI |
| 2030 | 69.10 | 160.34 | 251.58 | 72.90 | 160.34 | 247.78 | -3.80 | -0.00 | 3.80 |
| 2040 | 68.82 | 160.06 | 251.30 | 72.70 | 160.14 | 247.58 | -3.88 | -0.08 | 3.72 |
| 2050 | 68.76 | 160.00 | 251.24 | 72.45 | 159.89 | 247.33 | -3.68 | 0.12 | 3.92 |
| 2060 | 68.75 | 159.99 | 251.23 | 72.58 | 160.02 | 247.46 | -3.83 | -0.03 | 3.77 |
| 2070 | 68.86 | 160.10 | 251.34 | 72.73 | 160.17 | 247.61 | -3.87 | -0.07 | 3.73 |
| 2080 | 69.40 | 160.64 | 251.88 | 73.18 | 160.62 | 248.06 | -3.78 | 0.02 | 3.82 |
| 2090 | 69.18 | 160.42 | 251.66 | 72.95 | 160.39 | 247.83 | -3.77 | 0.03 | 3.83 |
| 2100 | 69.18 | 160.42 | 251.66 | 73.34 | 160.78 | 248.22 | -4.16 | -0.36 | 3.44 |
Table 38 Average predicted values for \(\pm 95\%\) MPI and predicted radiation \(\widehat{r}\) \(Wm^{- 2}\) for the mean values per decade under RCP4.5 and RCP8.5 scenarios at Majors Creek. The difference between RCP4.5 and RCP8.5 is shown for the MPI (\(\Delta\) \(\pm 95\%\) MPI) as well as for the mean estimated radiation \(\Delta\widehat{r}\).
|
RCP4.5 Average \(\mathbf{W}\mathbf{m}^{- \mathbf{2}}\) |
RCP8.5 Average \(\mathbf{W}\mathbf{m}^{- \mathbf{2}}\) |
Difference \(\mathbf{W}\mathbf{m}^{- \mathbf{2}}\) | |||||||
|---|---|---|---|---|---|---|---|---|---|
| Decade | -MPI | \[\widehat{\mathbf{r}}\] | +MPI | -MPI | \[\widehat{\mathbf{r}}\] | +MPI | \(\mathbf{\Delta}\) -MPI | \[\mathbf{\Delta}\widehat{\mathbf{r}}\] | \(\mathbf{\Delta}\) +MPI |
| 2030 | 140.08 | 231.32 | 322.56 | 141.74 | 229.18 | 316.62 | -1.66 | 2.14 | 5.94 |
| 2040 | 137.75 | 228.99 | 320.23 | 139.11 | 226.55 | 313.99 | -1.36 | 2.44 | 6.24 |
| 2050 | 136.24 | 227.48 | 318.72 | 137.04 | 224.48 | 311.92 | -0.80 | 3.00 | 6.80 |
| 2060 | 138.09 | 229.33 | 320.57 | 138.35 | 225.79 | 313.23 | -0.25 | 3.55 | 7.35 |
| 2070 | 143.85 | 235.09 | 326.33 | 143.58 | 231.02 | 318.46 | 0.27 | 4.07 | 7.87 |
| 2080 | 146.95 | 238.19 | 329.43 | 148.57 | 236.01 | 323.45 | -1.62 | 2.18 | 5.98 |
| 2090 | 147.24 | 238.48 | 329.72 | 149.57 | 237.01 | 324.45 | -2.33 | 1.47 | 5.27 |
| 2100 | 143.70 | 234.94 | 326.18 | 152.17 | 239.61 | 327.05 | -8.47 | -4.67 | -0.87 |
Table 39 Average predicted values for \(\pm 95\%\) MPI and predicted radiation \(\widehat{r}\) \(Wm^{- 2}\) for the maximum values per decade under RCP4.5 and RCP8.5 scenarios at Majors Creek. The difference between RCP4.5 and RCP8.5 is shown for the MPI (\(\Delta\) \(\pm 95\%\) MPI) as well as for the mean estimated radiation \(\Delta\widehat{r}\).
|
RCP4.5 Minimum (average) \(\mathbf{W}\mathbf{m}^{- \mathbf{2}}\) |
RCP8.5 Minimum (average) \(\mathbf{W}\mathbf{m}^{- \mathbf{2}}\) |
Difference RCP4.5 – RCP8.5 \(\mathbf{W}\mathbf{m}^{- \mathbf{2}}\) |
|||||||
|---|---|---|---|---|---|---|---|---|---|
| Decade | -MPI | \[\widehat{\mathbf{r}}\] | +MPI | -MPI | \[\widehat{\mathbf{r}}\] | +MPI | \(\mathbf{\Delta}\) -MPI | \[\mathbf{\Delta}\widehat{\mathbf{r}}\] | \(\mathbf{\Delta}\) +MPI |
| 2030 | 197.79 | 289.03 | 380.27 | 199.67 | 287.11 | 374.55 | -1.88 | 1.92 | 5.72 |
| 2040 | 196.64 | 287.88 | 379.12 | 198.08 | 285.52 | 372.96 | -1.44 | 2.36 | 6.16 |
| 2050 | 195.76 | 287.00 | 378.24 | 195.83 | 283.27 | 370.71 | -0.07 | 3.73 | 7.53 |
| 2060 | 194.91 | 286.15 | 377.39 | 196.53 | 283.97 | 371.41 | -1.63 | 2.17 | 5.97 |
| 2070 | 199.02 | 290.26 | 381.50 | 202.25 | 289.69 | 377.13 | -3.23 | 0.57 | 4.37 |
| 2080 | 201.73 | 292.97 | 384.21 | 203.99 | 291.43 | 378.87 | -2.26 | 1.54 | 5.34 |
| 2090 | 202.39 | 293.63 | 384.87 | 206.16 | 293.60 | 381.04 | -3.76 | 0.04 | 3.84 |
| 2100 | 201.24 | 292.48 | 383.72 | 207.49 | 294.93 | 382.37 | -6.25 | -2.45 | 1.35 |
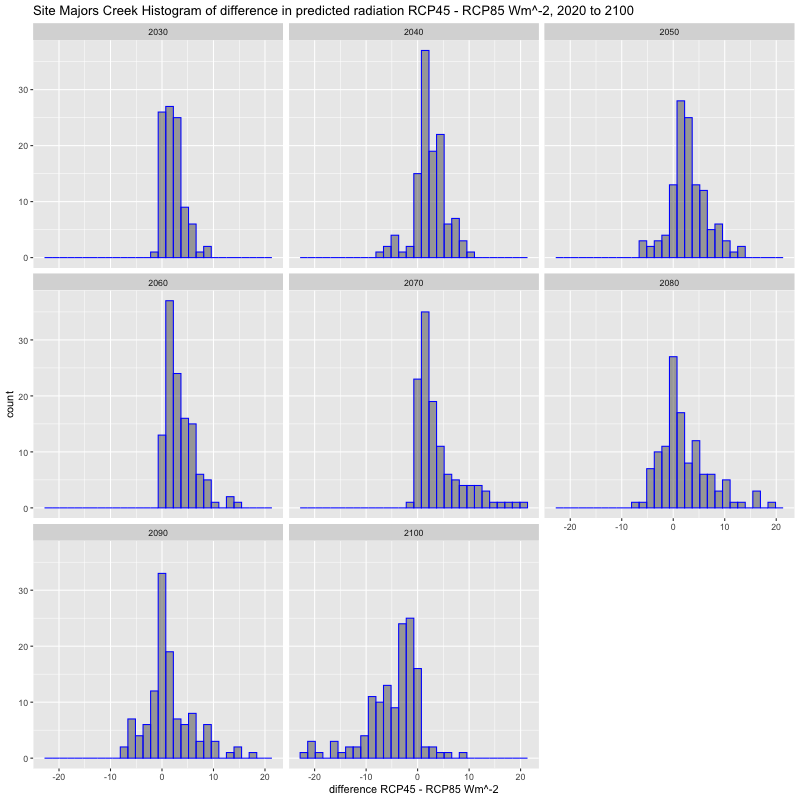
Figure 82 Differences in mean predicted radiation for profiles RCP4.5 and RCP8.5 at the Majors Creek station per decade between 2020 and 2100.
Differences between predictions under each profile are more pronounced for the 12 month moving average of the prediction at each site, indicating that the trend of the RCP8.5 scenario is lower than the RCP4.5 scenario, illustrated in Figure 83, Figure 84 and Figure 85. Moving averages under RCP8.5 exceed RCP4.5 in a number of sites during the final decade close to 2100 including Comet Post Office and Majors Creek. On examining the difference between RCP4.5 and RCP8.5 for each of these sites, we can see that a larger proportion in the trend for the difference between the profiles is distributed above 0, indicating that the projected trend for RCP8.5 is lower than that of the RCP4.5 trend with differences for decades in 2080 and 2090 being approximately between 0 and 15\(Wm^{- 2}\) (Figure 86 and Figure 87). For the decade 2090 – 2100 there are a number of examples where the RCP8.5 is predicted to exceed RCP4.5, this is more visible for the Majors Creek site where RCP8.5 exceeds RCP4.5 by approximately 5\(Wm^{- 2}\).
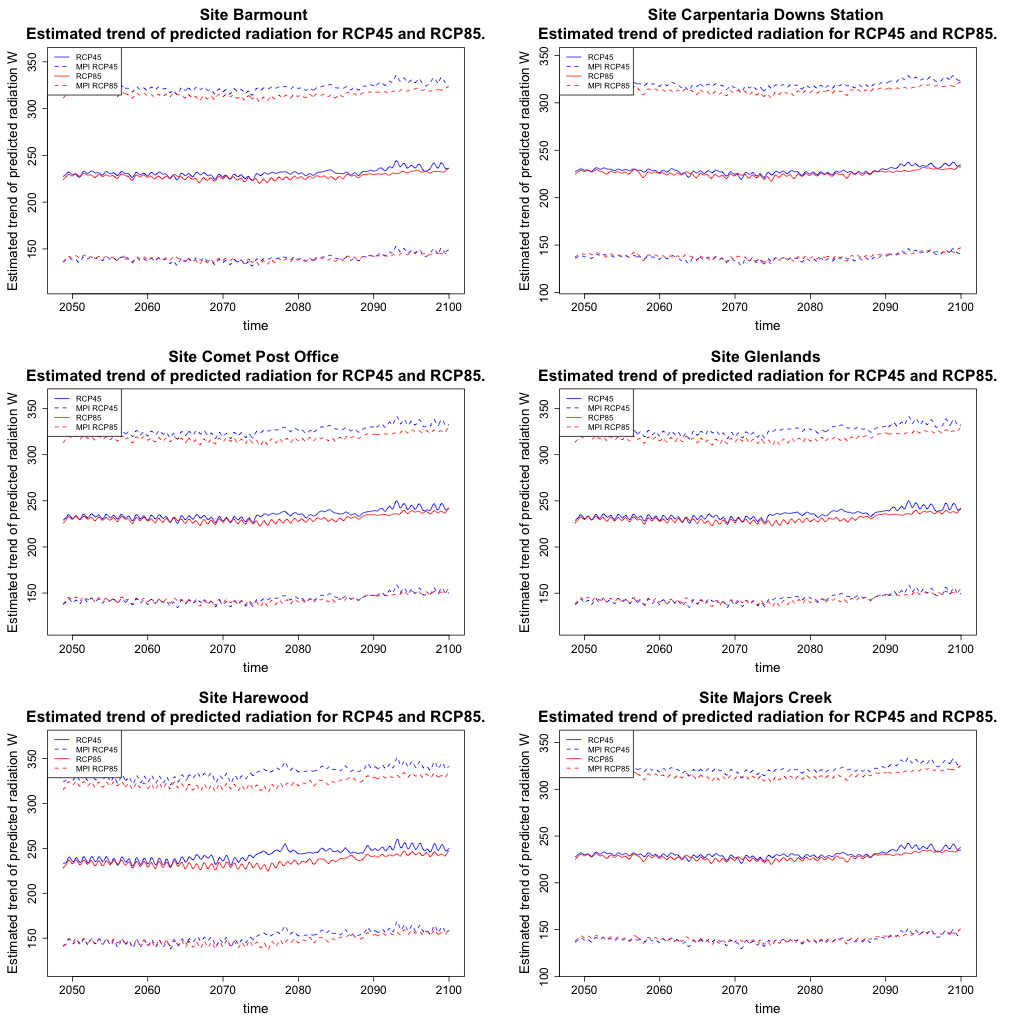
Figure 83 Estimated 12 month moving average of projected radiation and \(\pm\) 95% MPI from 2050 to 2100 for profiles RCP4.5 and RCP8.5.
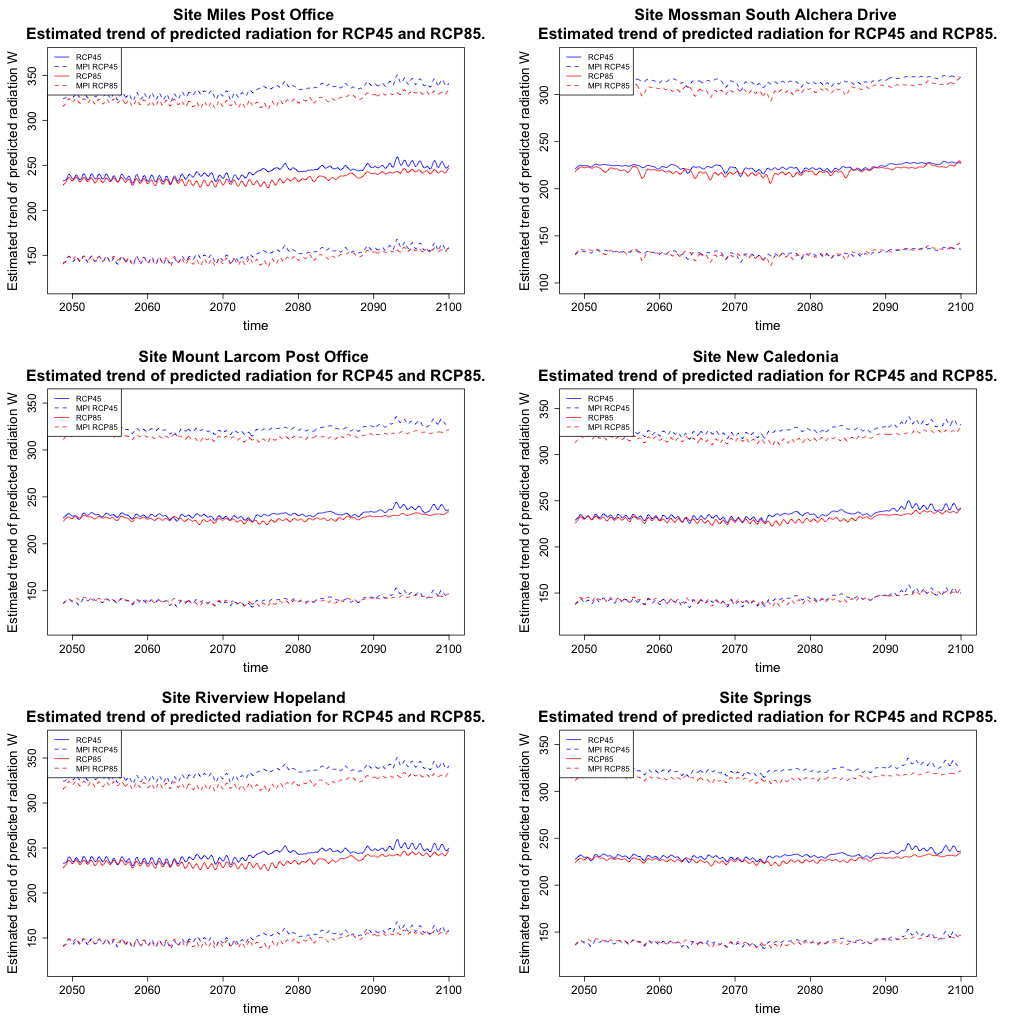
Figure 84 Estimated 12 month moving average of projected radiation and \(\pm\) 95% MPI from 2050 to 2100 for profiles RCP4.5 and RCP8.5.
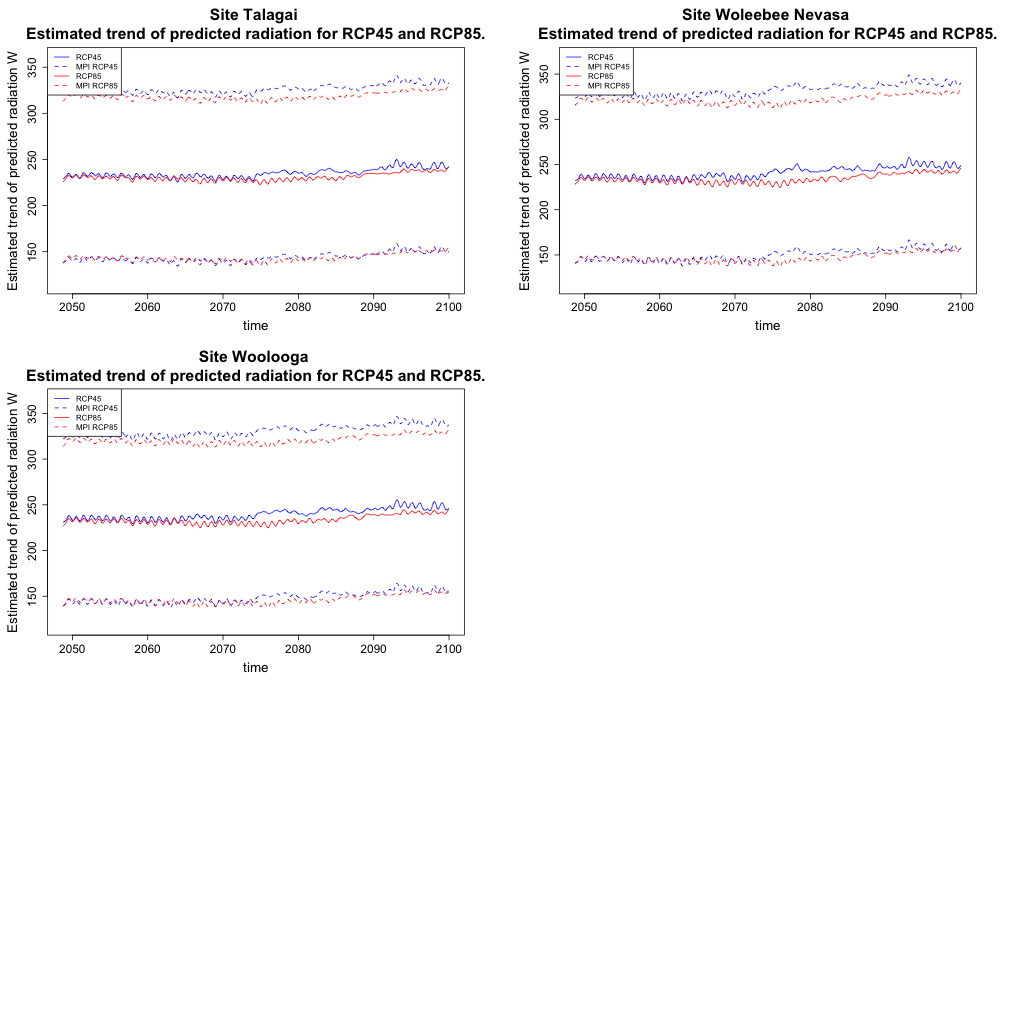
Figure 85 Estimated 12 month moving average of projected radiation and \(\pm\) 95% MPI from 2050 to 2100 for profiles RCP4.5 and RCP8.5.
Figure 86 Difference between RCP4.5 and RCP8.5 for the 12 month moving average of predicted radiation \(Wm^{- 2}\) at the Comet Office Site.
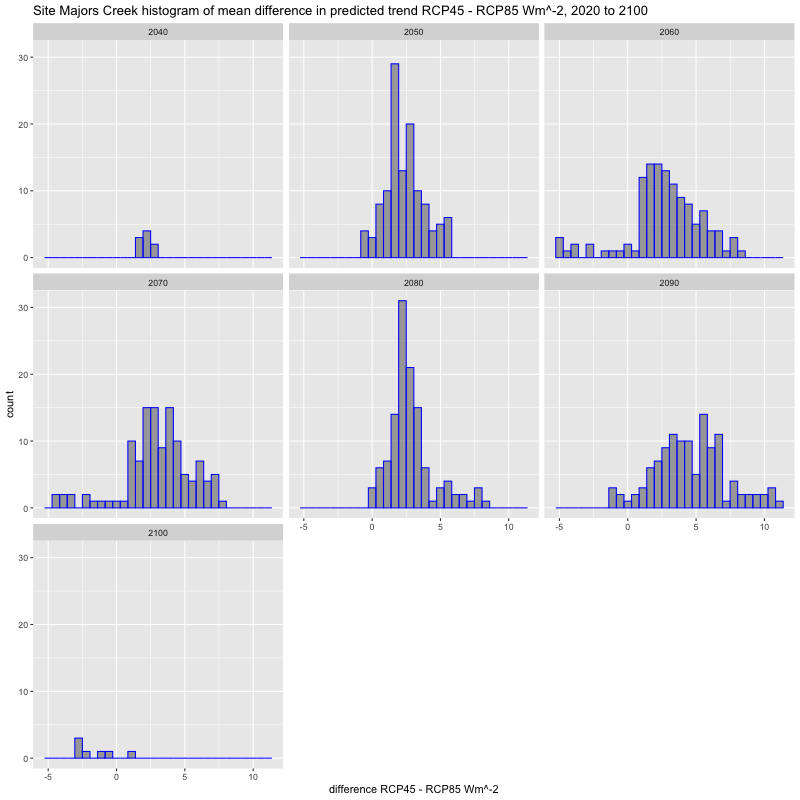
Figure 87 Difference between RCP4.5 and RCP8.5 for the 12 month moving average of predicted radiation Wm^-2 at the Majors Creek Site.

Downscaling Global Climate Models with Convolutional and Long-Short-Term Memory Networks for Solar Energy Applications by C.P. Davey is licensed under a Creative Commons Attribution-NonCommercial-ShareAlike 4.0 International License.