Chapter 3: Materials and Method
Overview
In this chapter the region of interest is introduced, identifying site locations and the mappings to observation stations. Pre-processing stages required for the GCM models are outlined, along with a summary of the covariates and their relationship to the target global solar radiation variable. Details as to evaluation metrics are introduced along with the methods applied for quantifying uncertainty. The CNN-LSTM model development process is presented including a description of the search procedures applied in defining the architecture and network configuration. Baseline models are introduced and the final configurations for each model are reported in the final section of the chapter.
Region of Study
A number of solar generation sites are in operation or are proposed within the state of Queensland, Australia. This study will focus on the a selection of solar sites having larger MW generation capacity, these are shown in Table 1 and their locations are shown in the left panel of Figure 1. As each individual site does not have global solar radiation observations publicly available for its exact latitude and longitude, ground truth observations are derived from the nearest corresponding Bureau of Meteorology observation station. The maximum distance is for the Clarke Creek solar project where the observation station Barmount is 27.6 km away, and the minimum distance corresponds to the Bouldercombe solar plant with the Glenlands observation station being only 0.8 km away. Hence the sites of interest will correspond to the mapped BOM stations shown in Table 2 and the right panel of Figure 1. The region extends from North Queensland to South East Queensland.
| Solar Site | Lon \(\mathbf{{^\circ}}\) | Lat \(\mathbf{{^\circ}}\) | Capacity MW |
|---|---|---|---|
| Wandoan | 149.76\({^\circ}E\) | 26.25\({^\circ}S\) | 1000 |
| Clarke Creek W&S | 149.35\({^\circ}E\) | 22.25\({^\circ}S\) | 400 |
| WDGPH | 150.68\({^\circ}E\) | 26.96\({^\circ}S\) | 390 |
| Gympie | 152.44\({^\circ}E\) | 26.09\({^\circ}S\) | 350 |
| Raglan | 150.85\({^\circ}E\) | 23.76\({^\circ}S\) | 350 |
| Columboola | 150.3\({^\circ}E\) | 26.64\({^\circ}S\) | 310 |
| Bouldercombe | 150.5\({^\circ}E\) | 23.53\({^\circ}S\) | 280 |
| Edenvale | 150.6\({^\circ}E\) | 26.93\({^\circ}S\) | 280 |
| Kidston 2 | 144.12\({^\circ}E\) | 26.93\({^\circ}S\) | 270 |
| Aldoga | 151.05\({^\circ}E\) | 23.6\({^\circ}S\) | 265 |
| Bluff | 149.04\({^\circ}E\) | 23.6\({^\circ}S\) | 260 |
| Delga Park | 149.75\({^\circ}E\) | 26.27\({^\circ}S\) | 250 |
| Desailly | 145.38\({^\circ}E\) | 16.49\({^\circ}S\) | 250 |
| Rodds Bay | 151.59\({^\circ}E\) | 24.19\({^\circ}S\) | 250 |
| Comet | 148.77\({^\circ}E\) | 23.61\({^\circ}S\) | 235 |
| Gregory | 148.45\({^\circ}E\) | 23.14\({^\circ}S\) | 215 |
| Majors Creek | 146.86\({^\circ}E\) | 19.58\({^\circ}S\) | 200 |
Table 1 Selected Solar Project Sites within Region of Study. Data available from the Queensland Government Department of Science Interactive Energy Map [1]
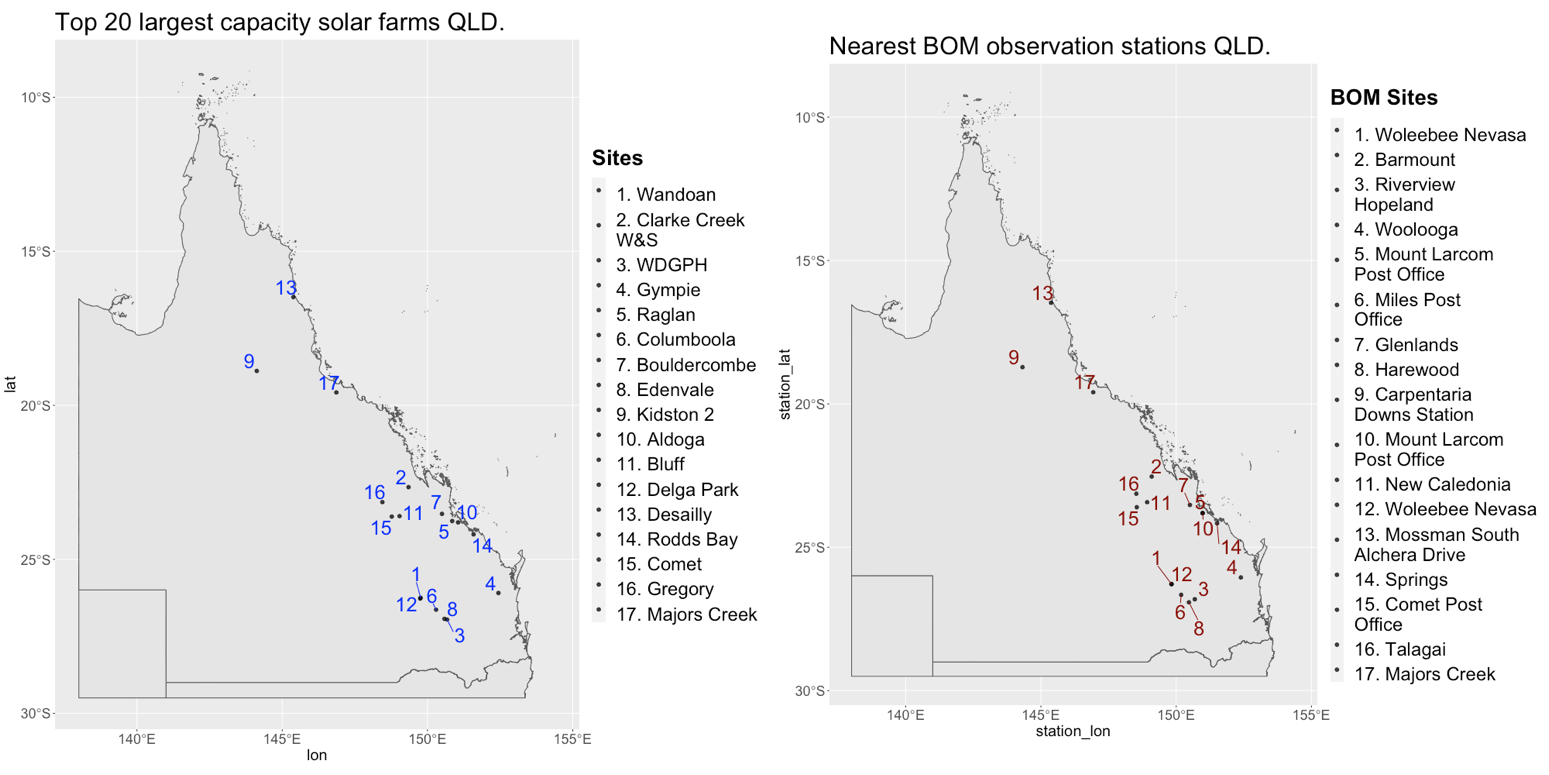
Figure 1 Selection of solar farms in Queensland identified for the study (left). The mapped BOM observation station (right).
| Solar Site |
Nearest BOM Site |
BOM Site Lon \(\mathbf{{^\circ}}\) |
BOM Site Lat \(\mathbf{{^\circ}}\) |
Distance from Solar Site in km |
|---|---|---|---|---|
| Wandoan | Woleebeenevasa | 149.82\({^\circ}E\) | 26.28\({^\circ}S\) | 7.4 |
| Clarke Creek W&S | Barmount | 149.09\({^\circ}E\) | 22.53\({^\circ}S\) | 27.6 |
| WDGPH | Riverview Hopeland | 150.68\({^\circ}E\) | 26.81\({^\circ}S\) | 15.6 |
| Gympie | Woolooga | 152.39\({^\circ}E\) | 26.05\({^\circ}S\) | 6.8 |
| Raglan | Mount Larcom Post Office | 150.97\({^\circ}E\) | 23.81\({^\circ}S\) | 13.8 |
| Columboola | Miles Post Office | 150.18\({^\circ}E\) | 26.65\({^\circ}S\) | 11 |
| Bouldercombe | Glenlands | 150.50\({^\circ}E\) | 23.52\({^\circ}S\) | 0.8 |
| Edenvale | Harewood | 150.47\({^\circ}E\) | 26.91\({^\circ}S\) | 10.8 |
| Kidston 2 | Carpentaria Downs Station | 144.31\({^\circ}E\) | 18.71\({^\circ}S\) | 25.3 |
| Aldoga | Mount Larcom Post Office | 150.97\({^\circ}E\) | 23.81\({^\circ}S\) | 7.4 |
| Bluff | New Caledonia | 148.92\({^\circ}E\) | 23.28\({^\circ}S\) | 21.6 |
| Delga Park | Woleebee Nevasa | 149.82\({^\circ}E\) | 26.28\({^\circ}S\) | 7.7 |
| Desailly | Mossman South Alchera Drive | 145.37\({^\circ}E\) | 16.47\({^\circ}S\) | 1.9 |
| Rodds Bay | Springs | 151.51\({^\circ}E\) | 24.16\({^\circ}S\) | 7.5 |
| Comet | Comet Post Office | 148.54\({^\circ}E\) | 23.60\({^\circ}S\) | 21.4 |
| Gregory | Talagai | 148.52\({^\circ}E\) | 23.13\({^\circ}S\) | 7.6 |
| Majors Creek | Majors Creek | 146.93\({^\circ}E\) | 19.59\({^\circ}S\) | 6.9 |
Table 2 Nearest BOM observation stations for project sites within region of study.
Differences in average monthly global solar radiation for the period 1950 to 2006 occur between the sites of interest. Sites exhibiting lower extremes of average monthly global solar radiation during the summer periods include the sites Mossman South Alchera Drive and Woolooga. Extremes during the summer months for higher average global solar radiation occur at the sites Carpentaria Downs Station, Comet Post Office and Carpentaria Downs Station. Upper ranges for average global solar radiation during the winter months occur at Carpentaria Downs Station, Majors Creek and Mossman South Alchera Drive, while lower values of average global solar radiation occur at Harewood and Riverview Hopeland. Values for average global solar radiation at each site for the period 1950 to 2006 are shown in Figure 2 and Table 3, the profile plot illustrated in Figure 3 shows the average observations overlayed for each site and compares the differences in the upper and lower extremes between sites.
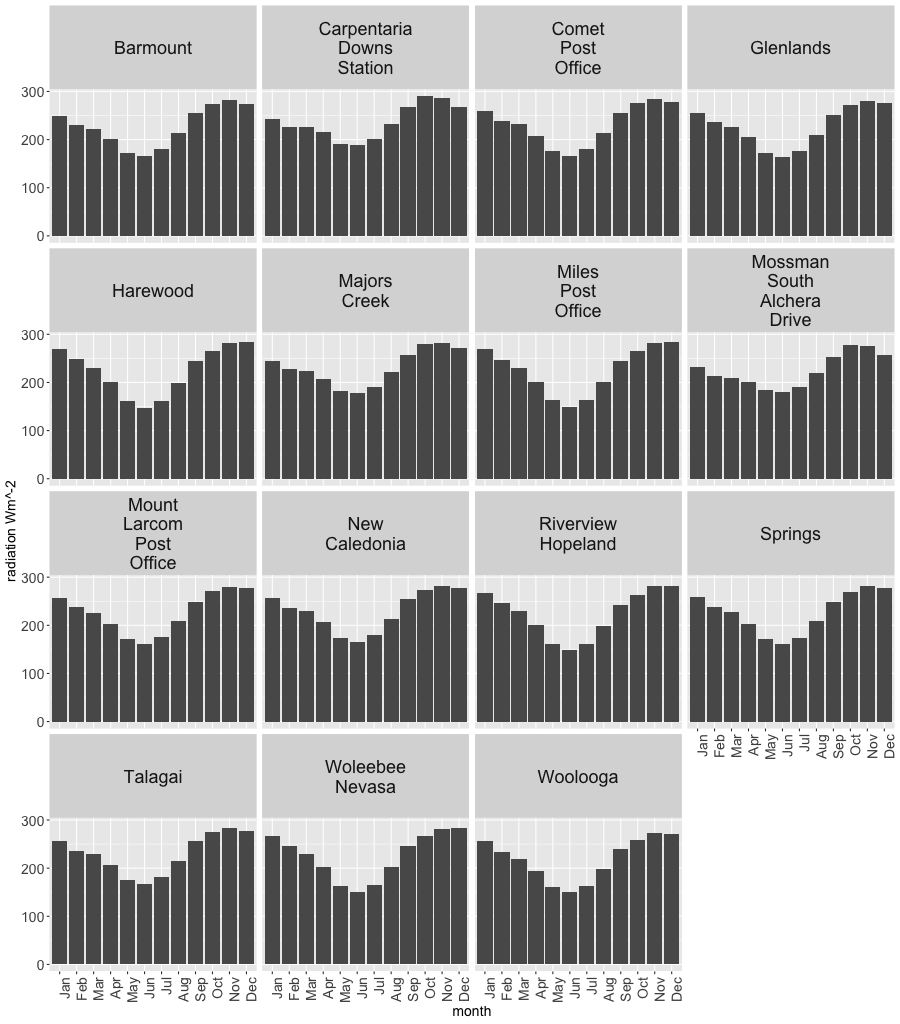
Figure 2 Average monthly global solar radiation \(Wm^{- 2}\) for each site retrieved from the training and test data between 1950 and 2006.
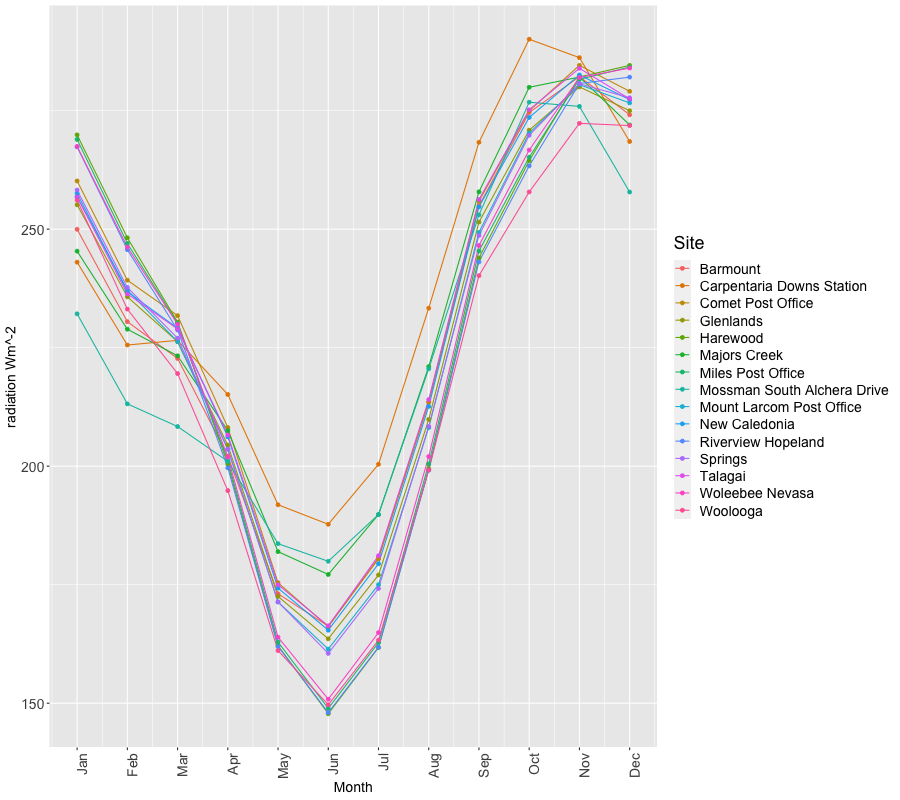
Figure 3 Profile plot for the average monthly global solar radiation \(Wm^{- 2}\) for the period 1950 to 2006 for each site. Differences between sites are evident during both summer and winter months.
| Site | Jan | Feb | Mar | Apr | May | Jun | Jul | Aug | Sep | Oct | Nov | Dec |
|---|---|---|---|---|---|---|---|---|---|---|---|---|
| Barmount | 249.97 | 230.48 | 222.73 | 202.15 | 173.08 | 166.26 | 180.70 | 213.49 | 254.92 | 274.59 | 282.16 | 274.13 |
| Carpentaria Downs Station | 243.03 | 225.55 | 226.54 | 215.12 | 191.86 | 187.75 | 200.40 | 233.33 | 268.32 | 290.06 | 286.17 | 268.49 |
| Comet Post Office | 260.16 | 239.23 | 231.76 | 208.15 | 175.41 | 166.15 | 180.45 | 213.53 | 255.91 | 274.96 | 284.55 | 279.08 |
| Glenlands | 255.14 | 235.73 | 226.27 | 204.43 | 172.52 | 163.59 | 177.04 | 209.85 | 251.49 | 270.87 | 280.01 | 274.98 |
| Harewood | 269.88 | 248.18 | 230.40 | 200.43 | 162.13 | 147.78 | 161.74 | 199.48 | 243.92 | 264.43 | 282.10 | 284.55 |
| Majors Creek | 245.35 | 228.89 | 223.28 | 207.51 | 181.97 | 177.16 | 189.79 | 221.00 | 257.86 | 279.92 | 282.08 | 271.98 |
| Miles Post Office | 268.93 | 246.99 | 230.12 | 201.09 | 162.90 | 148.91 | 162.79 | 200.47 | 245.38 | 265.17 | 281.61 | 284.19 |
| Mossman South Alchera Drive | 232.14 | 213.15 | 208.36 | 201.02 | 183.65 | 179.94 | 189.79 | 220.55 | 253.01 | 276.77 | 275.89 | 257.83 |
| Mount Larcom Post Office | 256.83 | 237.13 | 226.29 | 203.59 | 171.35 | 161.42 | 175.00 | 208.15 | 249.33 | 270.25 | 280.46 | 276.63 |
| New Caledonia | 257.56 | 236.79 | 229.11 | 206.19 | 174.28 | 165.40 | 179.42 | 212.61 | 254.71 | 273.56 | 282.53 | 277.31 |
| Riverview Hopeland | 267.36 | 245.67 | 228.73 | 199.66 | 161.96 | 148.01 | 161.81 | 199.15 | 243.10 | 263.34 | 280.72 | 282.06 |
| Springs | 258.24 | 237.69 | 227.01 | 203.58 | 171.37 | 160.51 | 174.21 | 208.40 | 248.67 | 269.79 | 280.66 | 277.71 |
| Talagai | 256.77 | 236.34 | 228.94 | 206.55 | 175.00 | 166.32 | 181.10 | 214.05 | 256.24 | 275.18 | 283.93 | 277.47 |
| Woleebee Nevasa | 267.45 | 246.21 | 229.95 | 201.93 | 163.93 | 150.84 | 164.89 | 202.03 | 246.55 | 266.69 | 281.99 | 283.97 |
| Woolooga | 256.11 | 233.13 | 219.53 | 194.85 | 161.10 | 149.67 | 163.29 | 199.21 | 240.19 | 257.84 | 272.32 | 271.85 |
Table 3 Average global solar radiation \(Wm^{- 2}\) per month of year at each site in the study region for the period between 1950 and 2006.
References

Downscaling Global Climate Models with Convolutional and Long-Short-Term Memory Networks for Solar Energy Applications by C.P. Davey is licensed under a Creative Commons Attribution-NonCommercial-ShareAlike 4.0 International License.