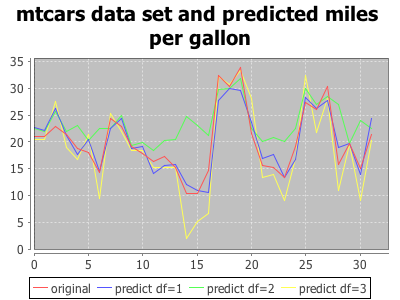
MT Cars Fuel Consumption - example use of class OrdLeastSquares
An example multivariate regression over the fuel consumption for a set of cars given a set of attributes from the R dataset mtcars
  mtcars - A data frame with 32 observations on 11 variables.
  *
  [, 1]	mpg	Miles/(US) gallon
  [, 2]	cyl	Number of cylinders
  [, 3]	disp	Displacement (cu.in.)
  [, 4]	hp	Gross horsepower
  [, 5]	drat	Rear axle ratio
  [, 6]	wt	Weight (1000 lbs)
  [, 7]	qsec	1/4 mile time
  [, 8]	vs	V/S
  [, 9]	am	Transmission (0 = automatic, 1 = manual)
  [,10]	gear	Number of forward gears
  [,11]	carb	Number of carburetors
The use example is taken from the example class ExampleMtCarsConsumption. The data is read as CSV and the target column is separated from the predictor variables.
  val inputFile = "data/cars/mtcars.csv"

  def readCars() = {
    val reader = new MatrixReader {}
    val M = reader.read(new File(inputFile))
    val X = M(::, 1 until M.cols)
    val Y = M(::, 0)
    (X, Y.toDenseVector)
  }
val (xMat, yVec) = readCars
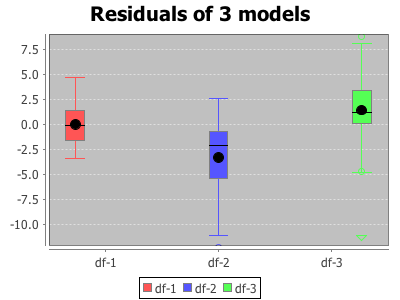
val ols1 = OrdLeastSquares(xMat, yVec, 1)
val (est1, error1) = ols1.train()
val Y1 = ols1.predict(xMat)
val ols2 = OrdLeastSquares(xMat, yVec, 2)
val (est2, error2) = ols2.train()
val Y2 = ols2.predict(xMat)
val ols3 = OrdLeastSquares(xMat, yVec, 3)
val (est3, error3) = ols3.train()
val Y3 = ols3.predict(xMat)
The Beta parameter z-scores and p-values in the example are accessed using the following:
    println(s"Model 1: P-Values\n")
    printValues(ols1.betaPValue.toDenseVector)
    println("\n")
    println("Model 1: Z-Values\n")
    printValues(ols1.betaZScore.toDenseVector)

    println(s"Model 1: Critical Beta Value: ${ols1.criticalBetaZValue}")
    println(s"Model 1: Critical PValue: ${ols1.criticalPValue}")
            Model 1: P-Values

0.0
0.3652613211066145
0.3984387352974198
0.3976368502242137
0.0048969511992071005
1.0568802173001641E-43
0.0033237033130584254
0.19474123424914283
1.0222461526756827E-20
0.018876079706805125
0.30077756098169905

            Model 1: Z-Values

46.37027436574356
-0.42000880973224936
0.05025928055824771
-0.08096411105282786
2.966548141714111
-14.002635401119749
3.0944263212321235
1.197618530512598
9.498501040691133
2.470190781809722
-0.7515926480275557

            Model 1: Critical Beta Value: 1.6000000000000003

            Model 1: Critical PValue: 0.11092083467945553